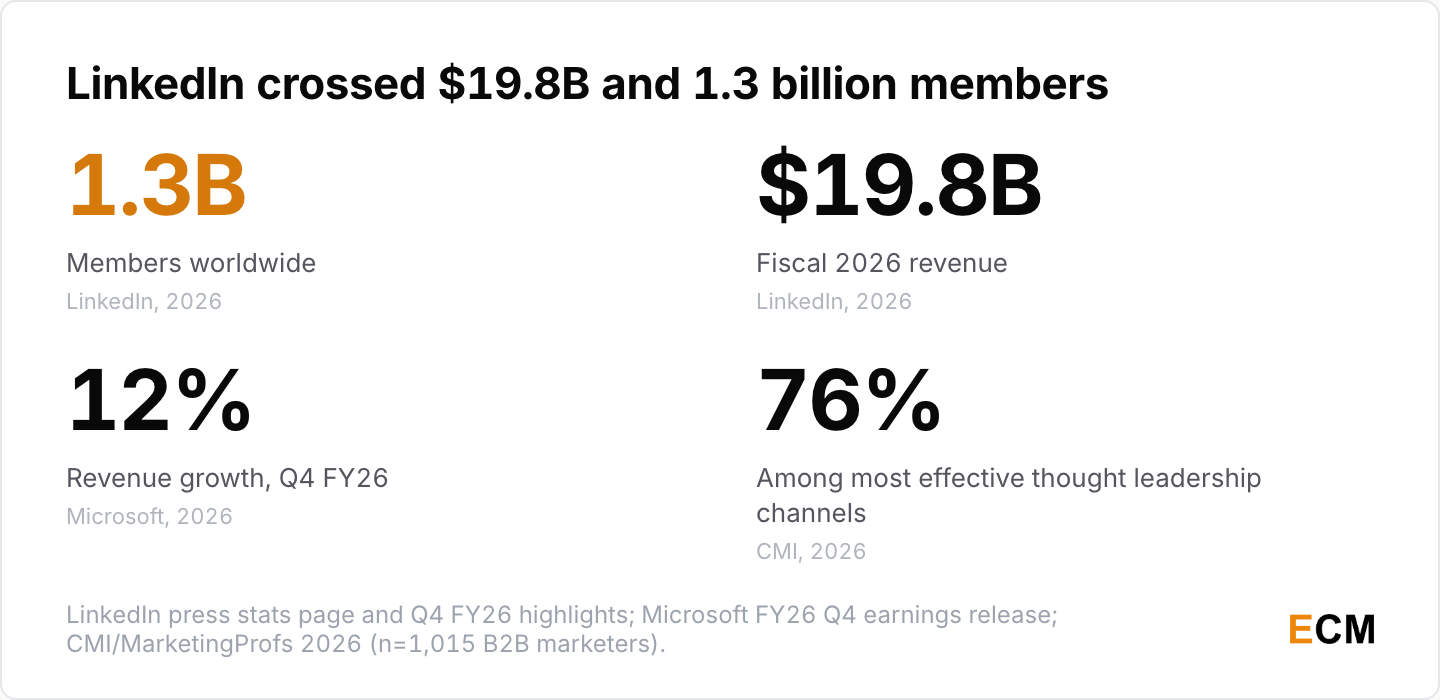
LinkedIn closed fiscal 2026 with $19.8 billion in annual revenue and more than 1.3 billion members (LinkedIn, 2026). Those LinkedIn statistics sit on a fifth consecutive year of double-digit member growth (LinkedIn, 2026) and 12% revenue growth in the closing quarter (LinkedIn, Q4 FY26 highlights, 2026).
51 LinkedIn Statistics 2026: Members to Revenue
 Written by Editorial Staff
Key Takeaways
- The platform is bigger and growing faster than its reputation suggests. Revenue reached $19.8 billion in fiscal 2026 and grew 12% year over year in the closing quarter, alongside a fifth consecutive year of double-digit member growth (LinkedIn, Q4 FY26 highlights, 2026).
- B2B marketers put LinkedIn first for thought leadership. 76% name it among their most effective publishing channels, ahead of email newsletters at 54% (CMI and MarketingProfs, 2026).
- Reach is not the same as active users. LinkedIn’s ad tools report 1.20 billion reachable members, up 17.1% year over year, which is a registration count and not a monthly-active number (DataReportal, 2025).
- The audience is young and lopsided. 47.3% of the ad-reachable audience is 25 to 34, summed from the male and female shares DataReportal publishes, and the split is 56.9% male to 43.1% female (DataReportal, 2025).
- Visible engagement is falling while total engagement rises. Likes fell 13%, comments 17% and shares 10% year over year, yet overall engagement rose nearly 14% on clicks and video views (Metricool, 2026).
- Carousels still beat everything people actually post. Multi-image posts hit a 3.71% engagement rate against 1.80% for video (Metricool, 2026), and carousels draw 17x more interactions than images (Metricool, 2026).
- The money is moving to ads and AI hiring. Marketing Solutions revenue grew 16% year over year (LinkedIn, Q4 FY26 highlights, 2026) and agentic hiring products surpassed a $450 million annual revenue run rate (LinkedIn, Q3 FY26 highlights, 2026).
LinkedIn User Statistics and Member Counts
Microsoft stopped giving precise member counts after the billion milestone, so the honest number is rounded and updated a few times a year.
How Many People Use LinkedIn
LinkedIn reports members, not monthly active users, and the two get confused constantly.
- LinkedIn’s own stats page puts the platform at more than 1.3 billion members across 36 languages, with roughly 100% of the Fortune 500 represented (LinkedIn, 2026).
- The count moved from 1.2 billion in July 2025 (LinkedIn, 2025) to “nearly 1.3 billion” in October 2025 (LinkedIn, 2025) and “more than 1.3 billion” by April 2026 (LinkedIn, 2026), a fifth consecutive year of double-digit growth (LinkedIn, 2026).
- Activity per minute: 93 people add a new role to their profile, about 8,200 job applications get submitted, more than 18,000 connections are made and more than 1.8 million feed updates are viewed (LinkedIn, 2026).
- The Economic Graph behind all of it covers 1.3 billion members, 71 million companies, 145,000 schools and 42,000 skills (LinkedIn Economic Graph, 2026).
There is no published global monthly active user figure. Any number you see with decimal precision attached to “LinkedIn MAU” was estimated by somebody outside LinkedIn.
LinkedIn Members by Region
Europe, the Middle East and Africa is the largest region, which surprises most US marketers.
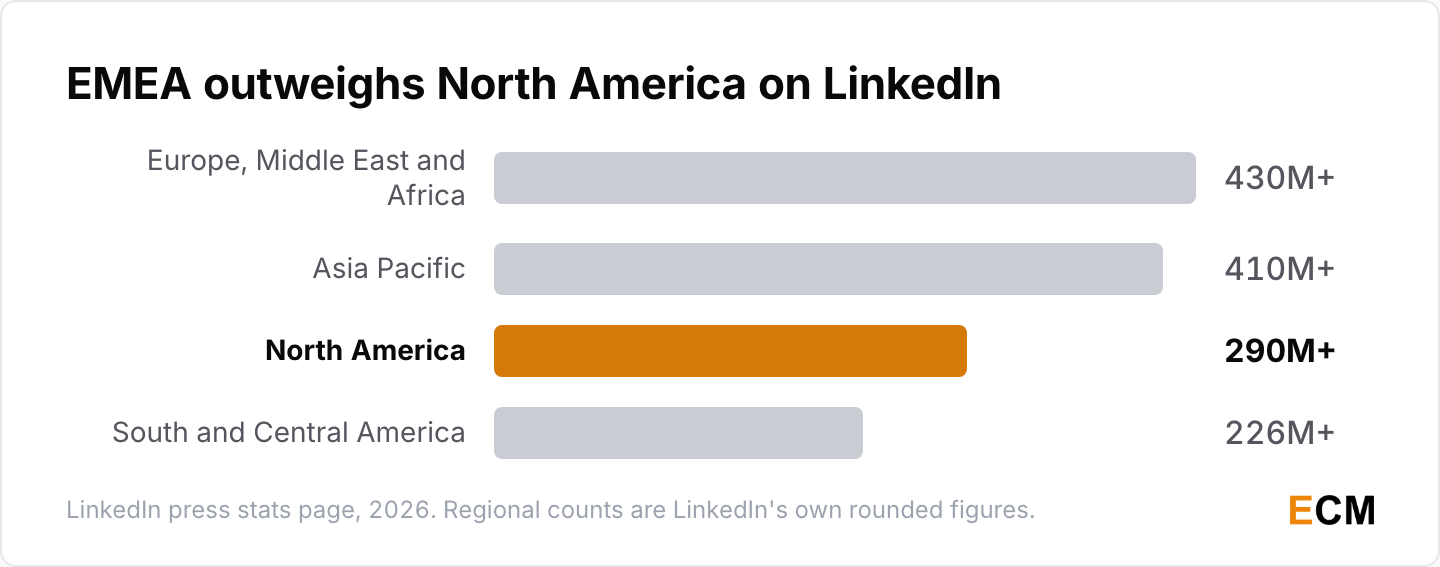
- Europe, the Middle East and Africa hold more than 430 million members, Asia Pacific more than 410 million, North America more than 290 million and South and Central America more than 226 million (LinkedIn, 2026). North America is under a quarter of the base.
LinkedIn Users by Country
Country-level numbers come from LinkedIn’s ad planning tools rather than its earnings disclosures.
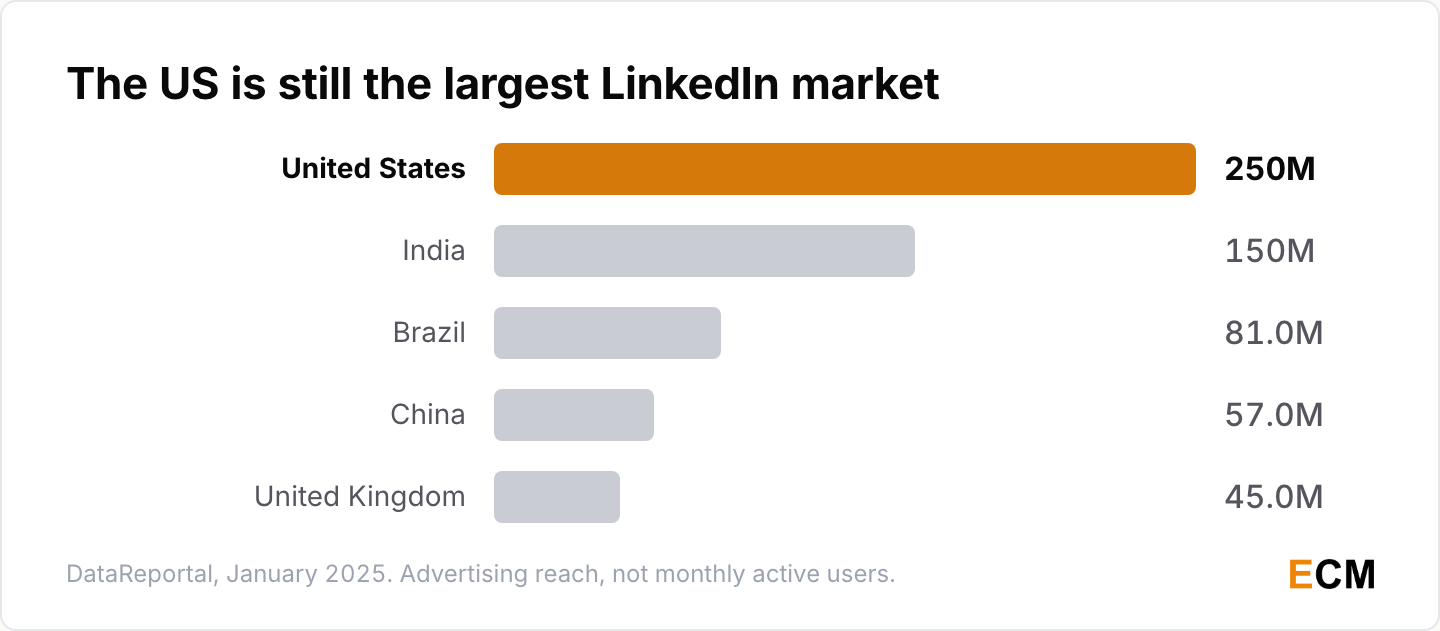
- The United States is the largest single market at 250 million ad-reachable members, followed by India at 150 million, Brazil at 81.0 million, China at 57.0 million and the United Kingdom at 45.0 million (DataReportal, 2025).
- Total advertising reach was 1.20 billion registered members in January 2025, up 176 million or 17.1% in a year, equal to 14.7% of the world’s population and about 21.6% of global internet users (DataReportal, 2025).
Advertising reach counts registered members aged 18 and over that LinkedIn says it can target. It isn’t comparable with a monthly active user disclosure from Meta or TikTok.
LinkedIn Demographics by Age and Gender
The demographic picture only exists because LinkedIn’s ad planner exposes it. LinkedIn itself publishes none of this.
LinkedIn Age Demographics
Nearly half the reachable audience is in one ten-year band, and it’s younger than the platform’s suit-and-tie reputation.
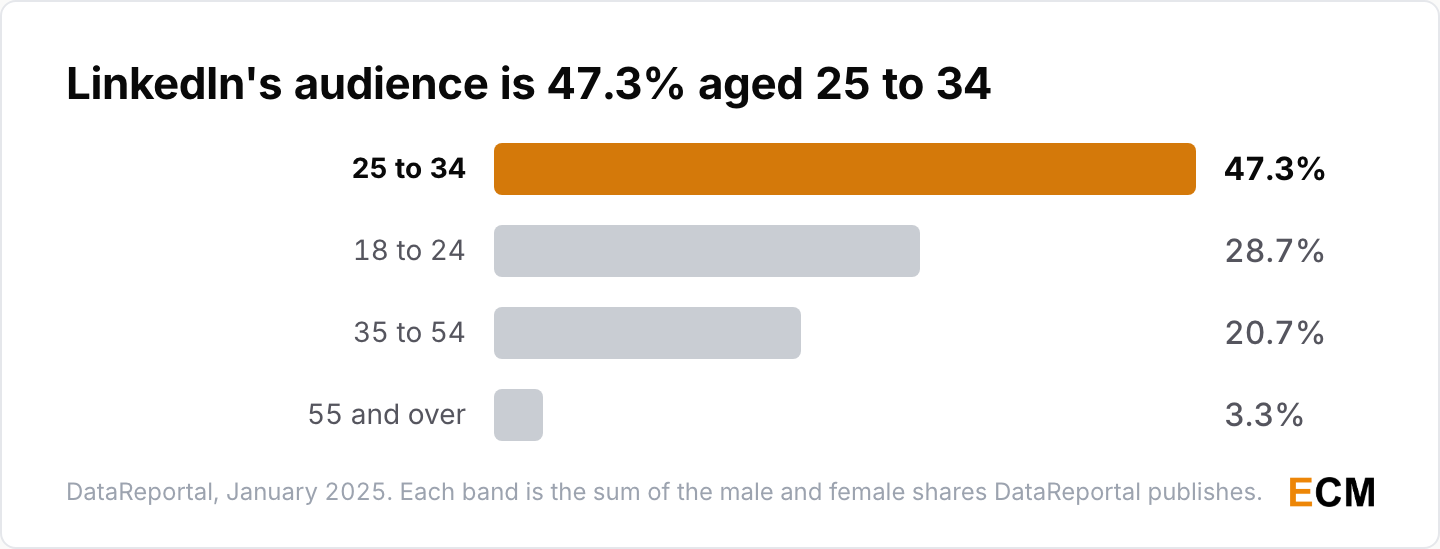
- 47.3% of LinkedIn’s ad-reachable audience is 25 to 34 and 28.7% is 18 to 24, each figure the sum of the separate male and female shares DataReportal publishes for that band (DataReportal, 2025).
- The 35 to 54 band holds 20.7% on the same male-plus-female basis and 55 and over holds 3.3%, so more than three quarters of the reachable audience is under 35 (DataReportal, 2025).
LinkedIn Gender Demographics
LinkedIn’s ad audience leans male, and the regional detail below the headline split is where the useful part sits.
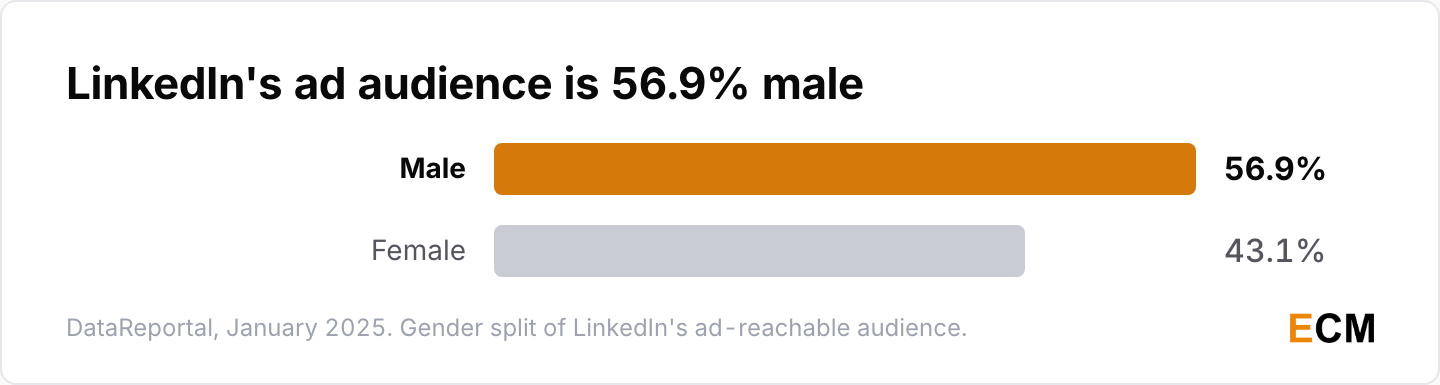
- LinkedIn’s ad-reachable audience is 56.9% male and 43.1% female (DataReportal, 2025).
- The split flips by region: female members are 29.7% of potential ad reach across Southern Asia and 31.5% across Western Asia, against 50.9% in the Caribbean and 49.6% in Northern America (DataReportal, 2025).
LinkedIn Revenue and Advertising Growth Statistics
Microsoft’s Form 10-K is the only audited source for LinkedIn revenue. The rest comes from Microsoft’s earnings releases and LinkedIn’s own press pages.
LinkedIn Annual Revenue Growth
The revenue curve hasn’t flattened, which isn’t what a platform this old usually does.
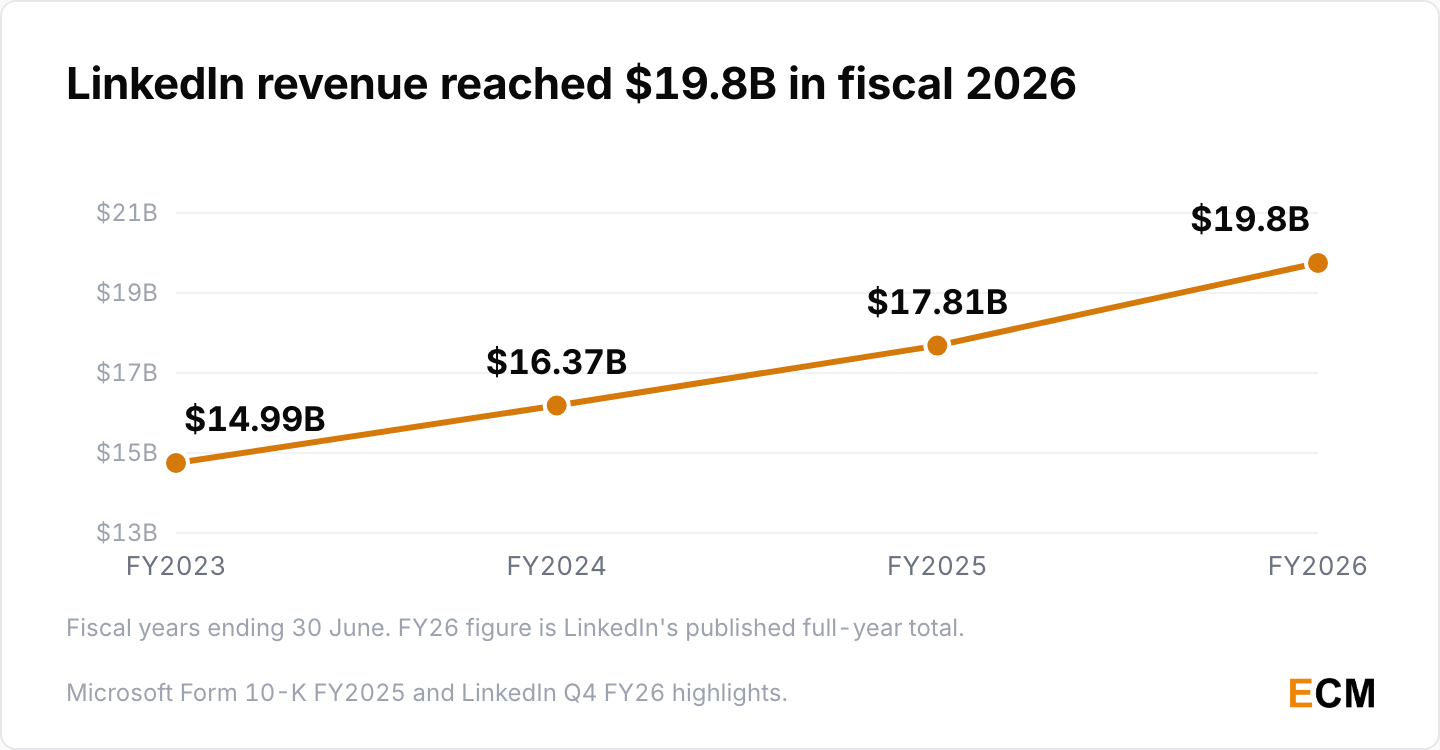
- Fiscal 2026 revenue reached $19.8 billion (LinkedIn, Q4 FY26 highlights, 2026).
- That follows $17.81B in fiscal 2025, $16.37B in fiscal 2024 and $14.99B in fiscal 2023 (Microsoft Form 10-K, 2025).
- Trailing twelve month revenue hit $18 billion in October 2025, up 10% year over year (LinkedIn, 2025), after a fiscal 2025 gain of $1.4 billion or 9% across all lines of business (Microsoft Form 10-K, 2025).
Quarterly LinkedIn Revenue Growth
Growth climbed through fiscal 2026 and held at 12% for two quarters, so no single period carried the annual line.
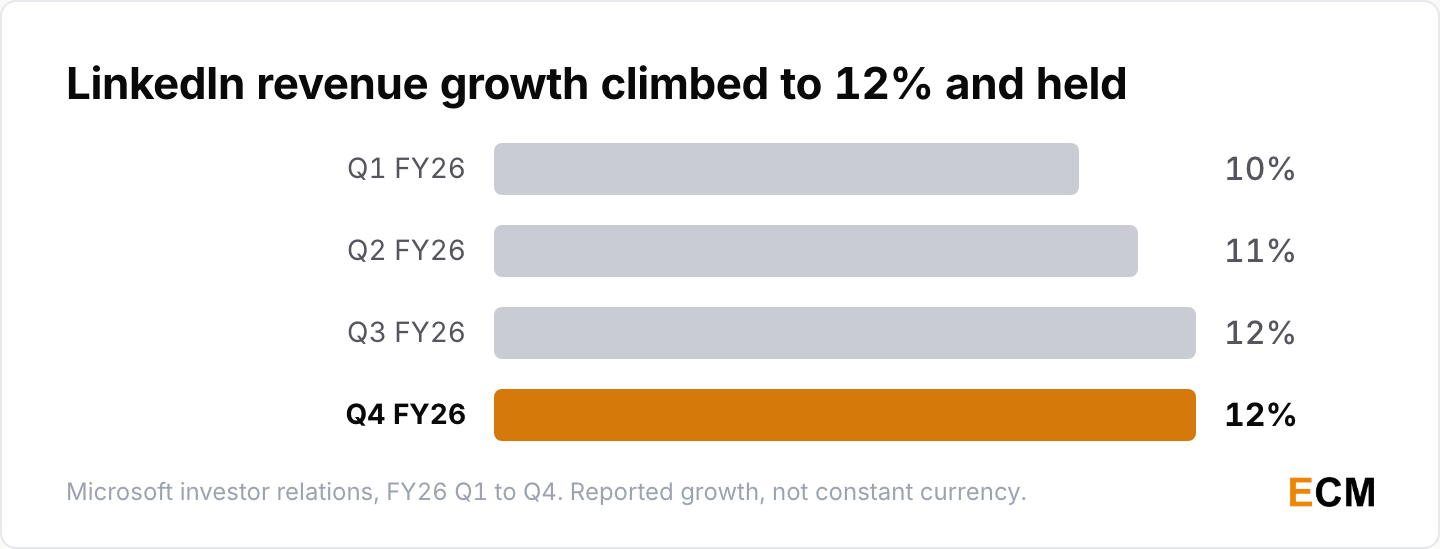
- Q1 fiscal 2026 revenue rose 10%, or 9% in constant currency (Microsoft, 2025).
- Q2 added $495 million, an 11% increase “driven by growth in Marketing Solutions” (Microsoft, 2026).
- Q3 rose 12%, or 9% in constant currency (Microsoft, 2026), and Q4 also rose 12%, or 10% in constant currency (Microsoft, 2026).
Which LinkedIn Business Lines Grew
Marketing Solutions is the line that matters if you buy ads, and it’s outrunning the platform average.
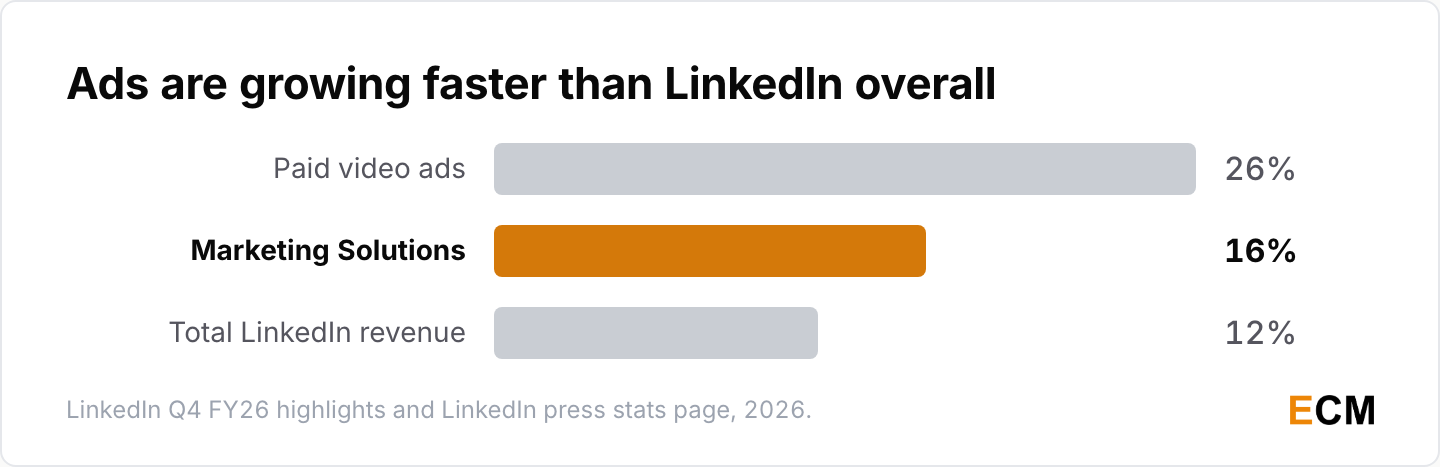
- Marketing Solutions revenue grew 16% year over year, a seventh consecutive quarter of double-digit growth (LinkedIn, Q4 FY26 highlights, 2026).
- Paid video advertising grew 26% year over year (LinkedIn, 2026), having run at nearly 30% growth a quarter earlier (LinkedIn, Q3 FY26 highlights, 2026).
- Agentic hiring products surpassed a $450 million annual revenue run rate (LinkedIn, Q3 FY26 highlights, 2026).
LinkedIn B2B Marketing Statistics for 2026
The Content Marketing Institute and MarketingProfs survey runs annually, and it moved its LinkedIn question between editions.
Where B2B Marketers Rank LinkedIn
LinkedIn wins both questions CMI has asked about it, by a distance.
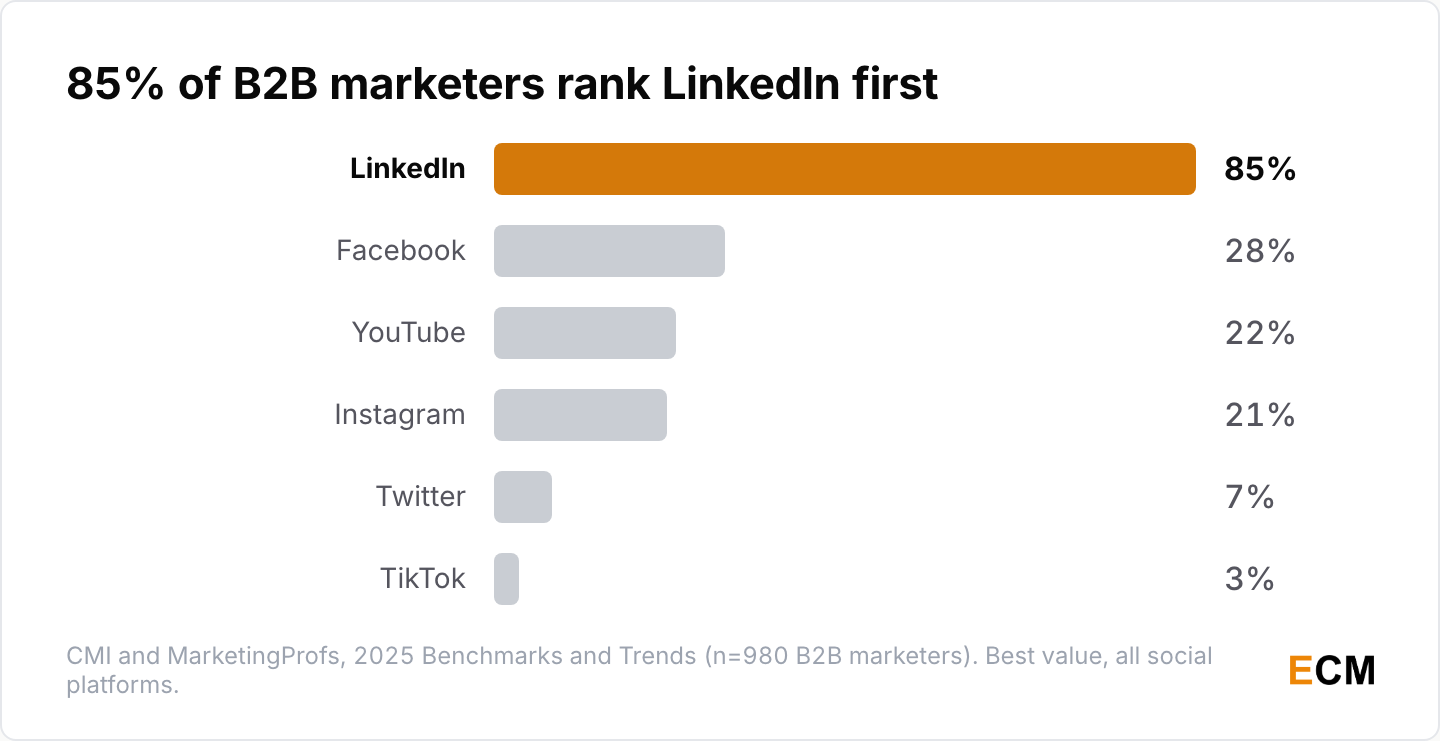
- 85% of B2B marketers said LinkedIn is the social media platform that delivers the best value (CMI and MarketingProfs, 2025).
- No other platform comes close on that question: Facebook at 28%, YouTube at 22%, Instagram at 21%, Twitter at 7% and TikTok at 3% (CMI and MarketingProfs, 2025).
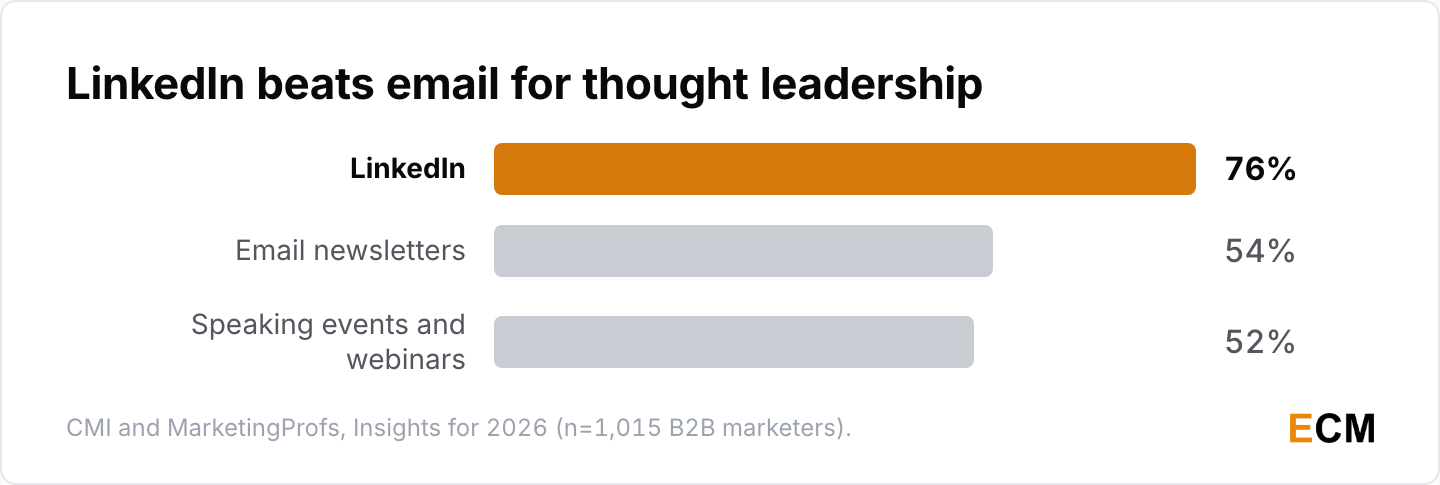
- 76% name LinkedIn among the most effective channels for publishing thought leadership, ahead of email newsletters at 54% and speaking events or webinars at 52% (CMI and MarketingProfs, 2026).
- 96% of B2B organizations create thought leadership content, but 37% say less than 5% of the employees with specialized knowledge or expertise actively contribute (CMI and MarketingProfs, 2026).
The 85% figure comes from the survey fielded in mid-2024 with 980 B2B respondents (CMI and MarketingProfs, 2025), and the 76% from the one fielded in mid-2025 with 1,015 (CMI and MarketingProfs, 2026). They answer different questions.
Thought Leadership and Buying Decisions
Edelman and LinkedIn co-publish an annual study on whether thought leadership moves B2B revenue.
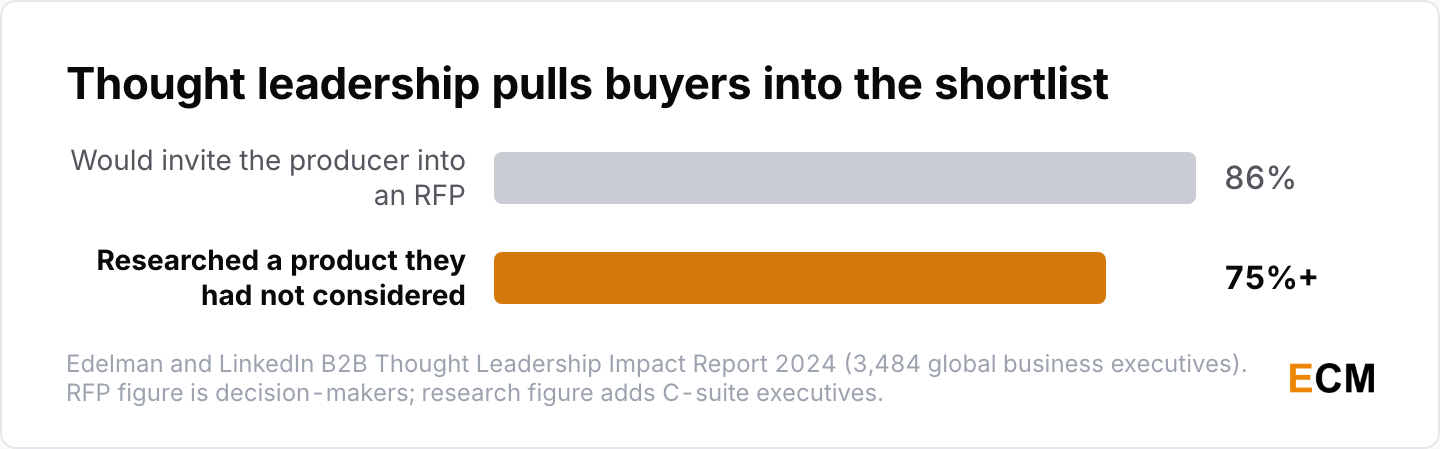
- More than 75% of decision-makers and C-suite executives say a piece of thought leadership led them to research a product or service they had not been considering, and 86% of decision-makers would be moderately or very likely to invite that organization into an RFP (Edelman and LinkedIn, 2024).
- The survey covered 3,484 global business executives across seven countries (Edelman and LinkedIn, 2024).
- 95% of business clients are not actively seeking goods or services at any given moment, the 95:5 rule Edelman and LinkedIn’s report footnotes to the Ehrenberg-Bass Institute (2022) (Edelman and LinkedIn, 2024).
- More than 40% of B2B deals stall because the buying group cannot align internally, a figure Edelman and LinkedIn’s 2025 report cites from Matt Dixon’s The JOLT Effect (2022) (Edelman and LinkedIn, 2025).
LinkedIn co-publishes this research, so the attitudinal numbers lean favorable to the channel. Read them next to the CMI survey rather than on their own.
How B2B Marketers Use AI
AI adoption among the B2B marketers CMI surveys is close to universal, which is worth knowing before you assume your feed is human.
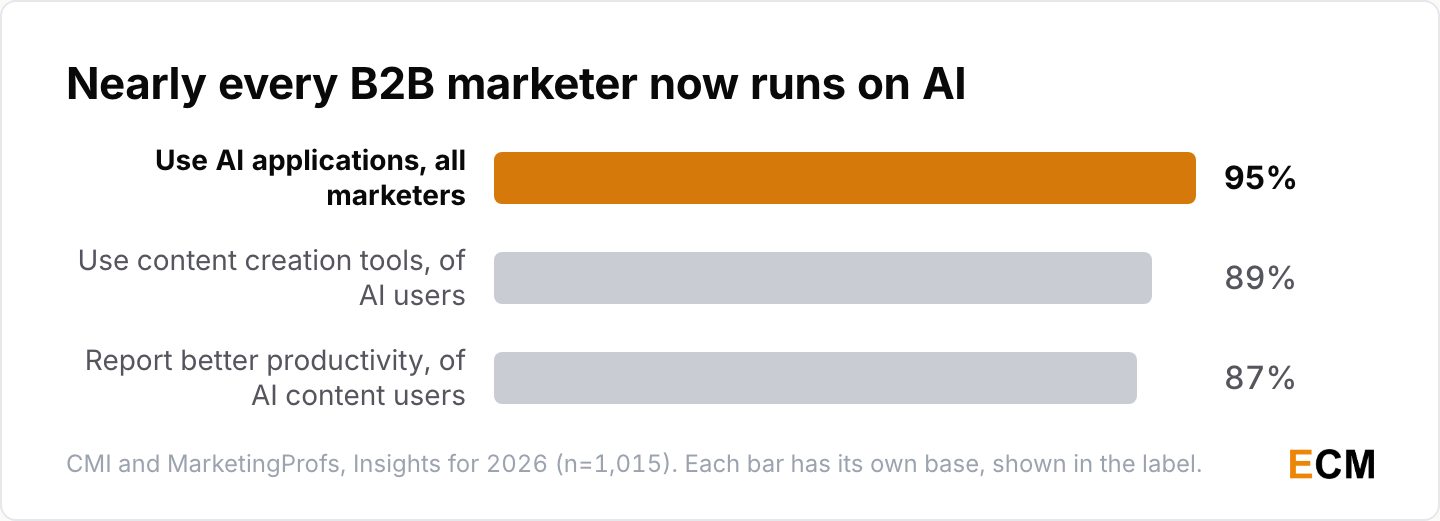
- 95% of B2B marketers say their organization uses AI-powered applications, and among those, 89% use content creation tools for copy (CMI and MarketingProfs, 2026).
- Among the marketers using AI for content creation, 87% say productivity has improved, and across all respondents 45% name AI-powered marketing tools as a top-three area to increase investment in during 2026 (CMI and MarketingProfs, 2026).
- Of those AI users, 53% use creative asset tools to generate or edit images and video (CMI and MarketingProfs, 2026), and among the 89% whose organizations personalize content, only 34% apply it to social media content (CMI and MarketingProfs, 2026).
If you’re deciding where that AI effort should land, my notes on AI content distribution cover the part most teams skip.
LinkedIn Engagement and Post Format Statistics
Two independent datasets cover post-level performance. Both are vendor-run, both disclose their samples, and they disagree in useful ways.
LinkedIn Engagement Trends in 2026
Every visible engagement signal is down while the total is up, on what Metricool calls invisible interactions.
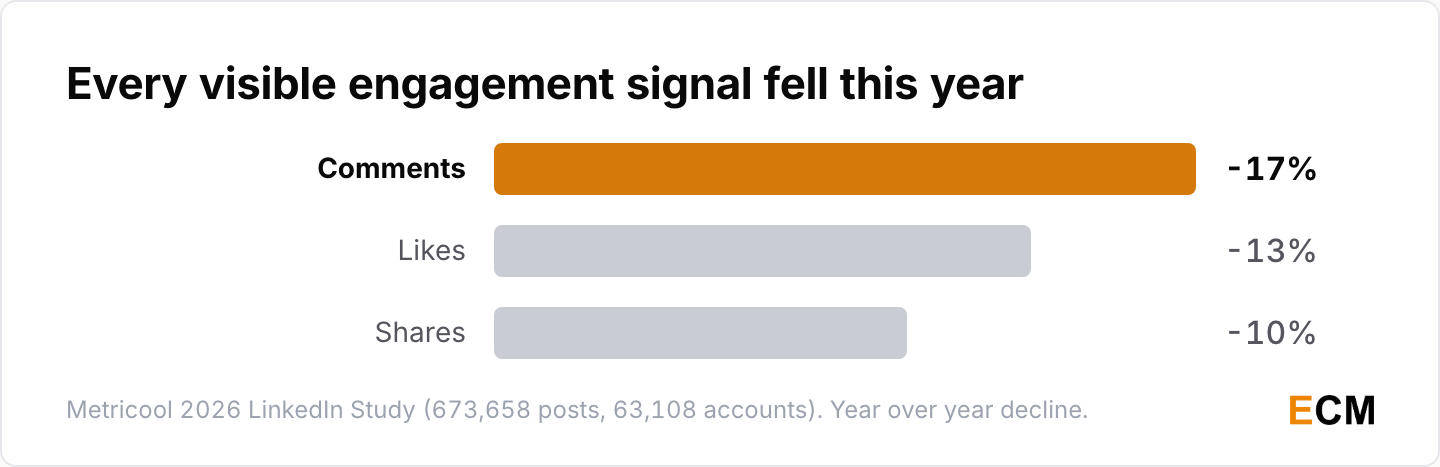
- Likes fell 13%, comments 17% and shares 10% year over year, while overall engagement rose nearly 14% on clicks, carousel swipes and video views (Metricool, 2026).
- Average clicks per post rose from 97.54 to 102.32, a 4.90% gain (Metricool, 2026).
- The measured engagement rate went from 12.21% to 13.90% while average posts per week fell about 10% (Metricool, 2026).
- The study covers 673,658 posts from 63,108 accounts worldwide (Metricool, 2026).
- Reach is the harder story: AuthoredUp puts average reach down 34% in 2025 (AuthoredUp, 2025).
The 13.90% is Metricool’s own engagement definition, which counts clicks, carousel swipes and video views. The 3.71% format figures below are engagement per post by format, a different denominator, which is why the two numbers don’t reconcile and neither matches your dashboard.
Which Post Formats Perform Best
The format gap between what performs and what people post is the single most actionable thing on this page.
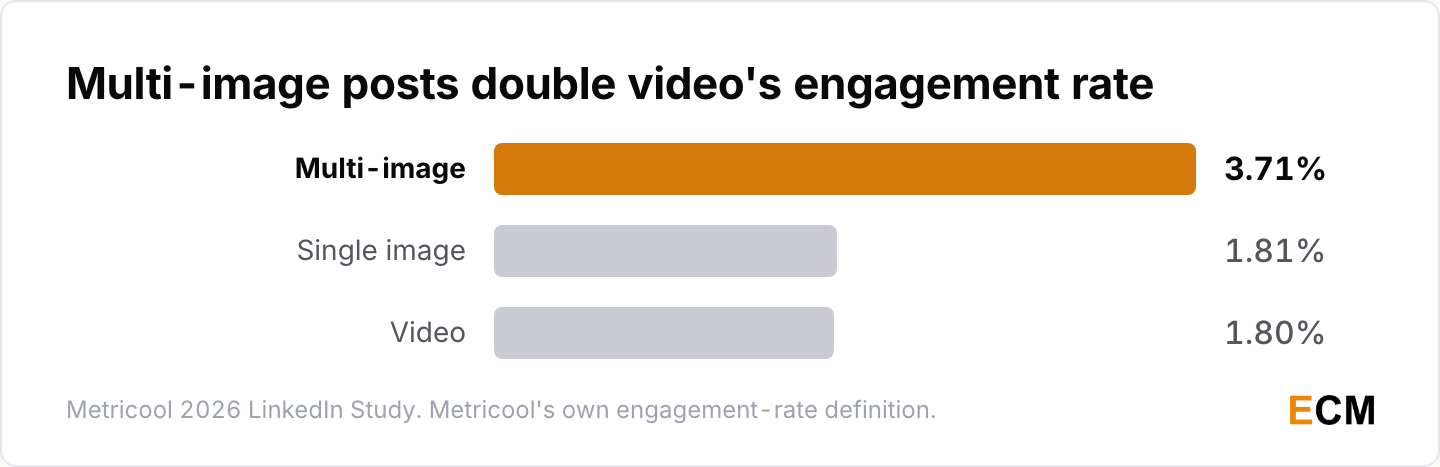
- Multi-image posts hit a 3.71% engagement rate against 1.81% for single images and 1.80% for video (Metricool, 2026).
- Carousels draw 17x more interactions than images, yet images are still posted 6x more than carousels (Metricool, 2026), and images plus video make up nearly 75% of all content (Metricool, 2026).
- Polls deliver the highest average impressions on Company Pages while making up under 1% of posts (Metricool, 2026).
- In AuthoredUp’s personal-profile sample, document posts carry a 1.45x reach multiplier, nearly unchanged from 1.46x a year earlier, though their median reach fell 25% (AuthoredUp, 2025). Vertical video use is up nearly 80%, which AuthoredUp reports with no sample stated (AuthoredUp, 2025).
- Video use rose 53% year over year in the prior edition of the Metricool study, which covered 577,180 posts (Metricool, 2025).
Carousels are the format I would build first. Everyone knows video is being pushed and almost nobody is making documents, which is exactly the gap worth exploiting. The same logic applies to video marketing on other platforms.
What Gets a Post Reach
Small craft decisions move these numbers more than posting frequency does.
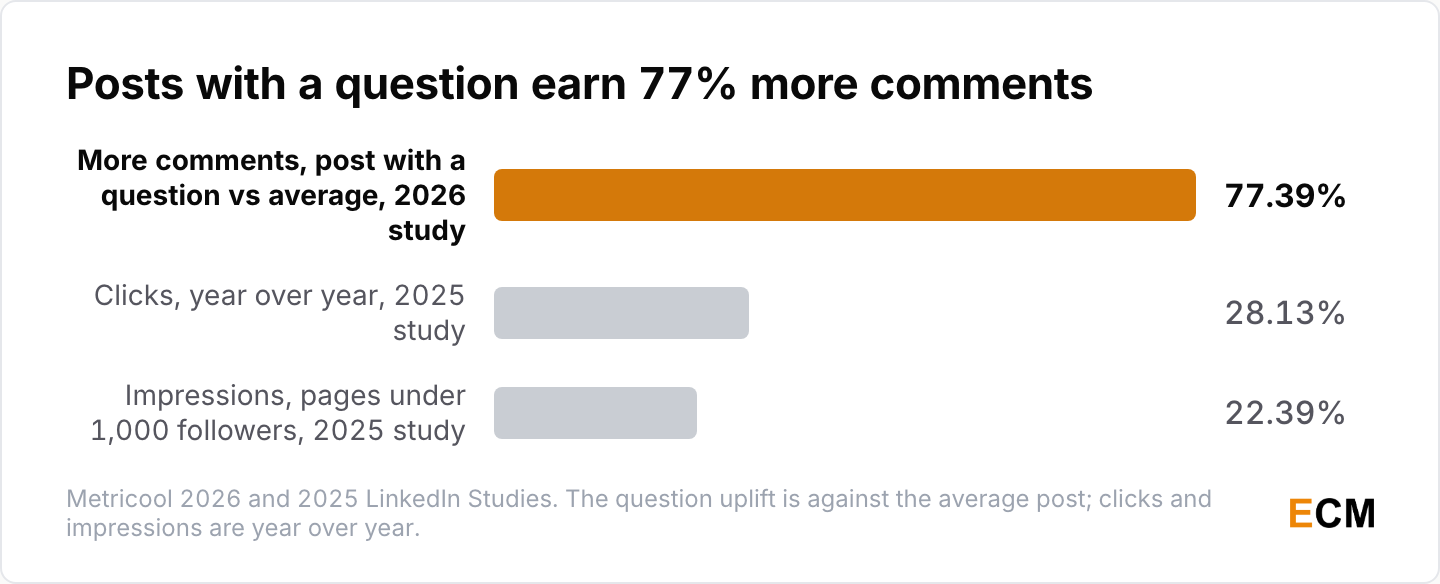
- Posts that include a direct question get 77.39% more comments (Metricool, 2026).
- Nearly 40% of all interactions on a post arrive on day one (Metricool, 2026).
- AuthoredUp calls 800 to 1,000 characters the sweet spot for post length, and separately finds the best-performing posts often run 16 to 20 sentences (AuthoredUp, 2025).
- Clicks rose 28.13% year over year, and pages under 1,000 followers saw impressions rise 22.39% (Metricool, 2025).
LinkedIn Recruiting and AI Hiring Statistics
Talent Solutions is LinkedIn’s oldest business and the one it has rebuilt around AI agents fastest.
AI Hiring Adoption and Tool Results
The hiring side runs at a volume marketing never sees, and these are LinkedIn’s own numbers with no control group.
- Recruiters at more than 20,000 companies now use LinkedIn’s AI-powered hiring products, with enterprise seats up 140% quarter over quarter (LinkedIn, Q4 FY26 highlights, 2026).
- Recruiters using Hiring Assistant review 81% fewer profiles to find a qualified match and see 66% higher InMail acceptance rates (LinkedIn Talent Solutions, 2026).
- The same page puts time saved at about 1.5 hours per role, with Expedia Group cutting time to hire by 30 days (LinkedIn Talent Solutions, 2026).
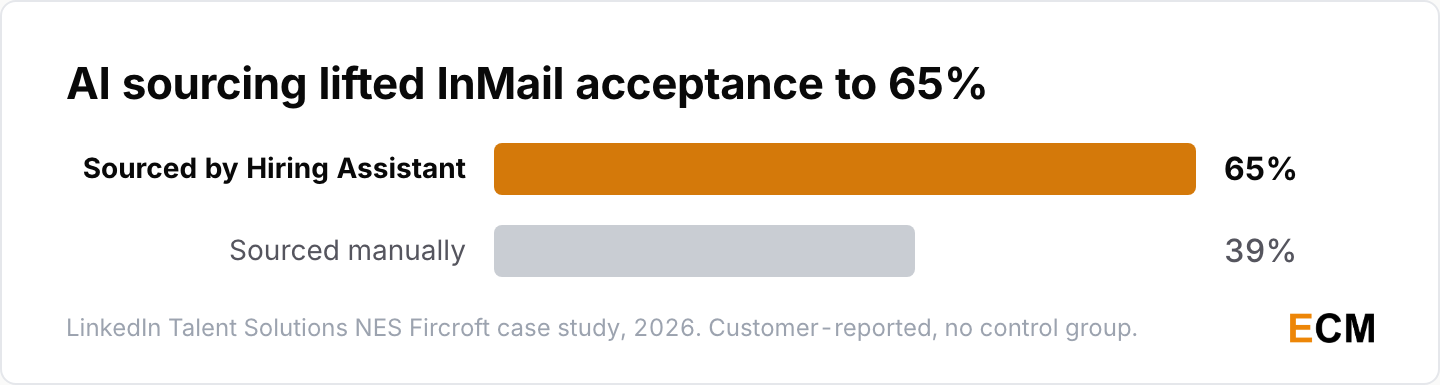
- NES Fircroft achieved a 65% InMail acceptance rate from candidates sourced via Hiring Assistant, compared to 39% from manually sourced candidates (LinkedIn Talent Solutions, 2026).
Recruiters who switch AI features on are usually the more proactive ones to begin with. These figures size the product, not your results.
LinkedIn Learning and Skills Data
Learning is the quietest part of the platform and the one with the clearest number.
- LinkedIn Learning carries more than 26,300 courses and learning paths (LinkedIn Learning, 2026).
- Members consume about 123 hours of learning content every minute (LinkedIn, 2026).
If you’re building a publishing habit around any of this, my write-up on content marketing statistics covers the wider benchmarks, and B2B writing covers the craft side.
Frequently Asked Questions
How many LinkedIn users are there in 2026?
LinkedIn reports more than 1.3 billion members and a fifth consecutive year of double-digit member growth (LinkedIn, 2026). That’s a registration count. LinkedIn doesn’t publish a global monthly active user number at all, and its ad tools separately report 1.20 billion reachable members (DataReportal, 2025).
What is LinkedIn’s annual revenue?
LinkedIn generated $19.8 billion in fiscal 2026, with revenue up 12% year over year in the closing quarter (LinkedIn, 2026). That’s up from $17.81B in fiscal 2025 (Microsoft Form 10-K, 2025). Microsoft doesn’t split the figure across Talent Solutions, Marketing Solutions, Premium and Sales Solutions.
Is LinkedIn still worth using in 2026?
For B2B, yes. 76% of B2B marketers name it among their most effective thought leadership channels, ahead of email newsletters at 54% (CMI and MarketingProfs, 2026). Revenue grew 12% in the closing quarter and Marketing Solutions 16% (LinkedIn, 2026). Organic reach is harder, with average reach down 34% in 2025 (AuthoredUp, 2025).
What is the 3/2/1 rule on LinkedIn?
It’s a creator heuristic for post mix, usually three value posts to two engagement posts to one promotional post. LinkedIn has never published it and no study measures it. What does hold up at the platform level: weekly posting volume fell about 10% (Metricool, 2026) while overall engagement rose nearly 14% (Metricool, 2026), and posts with a question earn 77.39% more comments (Metricool, 2026).
Which LinkedIn post format performs best?
Multi-image and document posts. Multi-image posts reach a 3.71% engagement rate against 1.81% for single images and 1.80% for video (Metricool, 2026), and carousels draw 17x more interactions than images while being posted 6x less often (Metricool, 2026). Document posts carry a 1.45x reach multiplier in AuthoredUp’s format sample of 994,894 posts from 63,407 personal profiles (AuthoredUp, 2025).
Where can I find official LinkedIn statistics?
Three places carry first-party numbers. LinkedIn’s press stats page lists members, per-minute activity and the $19.8 billion revenue figure (LinkedIn, 2026). The Economic Graph site publishes 71 million companies and 42,000 skills (LinkedIn Economic Graph, 2026). Microsoft’s investor pages carry the quarterly revenue line (Microsoft, 2026), and the audited annual figure sits in the Form 10-K, which puts LinkedIn at $19,817 million for fiscal 2026 (Microsoft Form 10-K, 2026).
How effective is LinkedIn for B2B lead generation?
Better evidence exists for influence than for leads. More than 75% of decision-makers and C-suite executives say thought leadership led them to research a product they had not considered, and 86% of decision-makers would invite that firm into an RFP (Edelman and LinkedIn, 2024).
Written by
Editorial Staff
The Editorial Staff represents the writers, editors, and content creators who have worked (or work) at Elite Content Marketer. The experimenter-in-chief behind the team is Chintan Zalani, who has close to a decade of experience trying to make sense of the content marketing industry. Started in 2019, Elite Content Marketer is on a mission to help creators build sustainable businesses.
Related Articles
Marketing Data
60 B2B Buyer Statistics for 2026: 94% Use AI
60 B2B buyer statistics for 2026: 94% of buyers use LLMs, first contact comes 61% into the journey, and 13 people join the average decision.
Sep 12, 2026Read more →
Marketing Data
60 Zero-Click Search Statistics for 2026: 68% No Click
60 zero-click search statistics for 2026: 68.01% of US Google searches end with no click, AI Overviews cut position 1 CTR 58%, publishers lost 33%.
Sep 12, 2026Read more →
Marketing Data
62 Martech Statistics 2026: Stack Size to ROI
62 martech statistics for 2026: 15,505 tools tracked, budgets at 7.8% of revenue, 49% of tools in use, and where AI agents fall short.
Sep 12, 2026Read more →