Influencer marketing reached an estimated $32.55 billion in 2025, up from $24 billion in 2024 (Influencer Marketing Hub, 2025). These influencer marketing statistics cover market size, budgets, ROI, platforms, consumer trust, creator pay and burnout.
Influencer Marketing Statistics 2026: 60 Facts + $33B Market
 Written by Editorial Staff
Key Takeaways
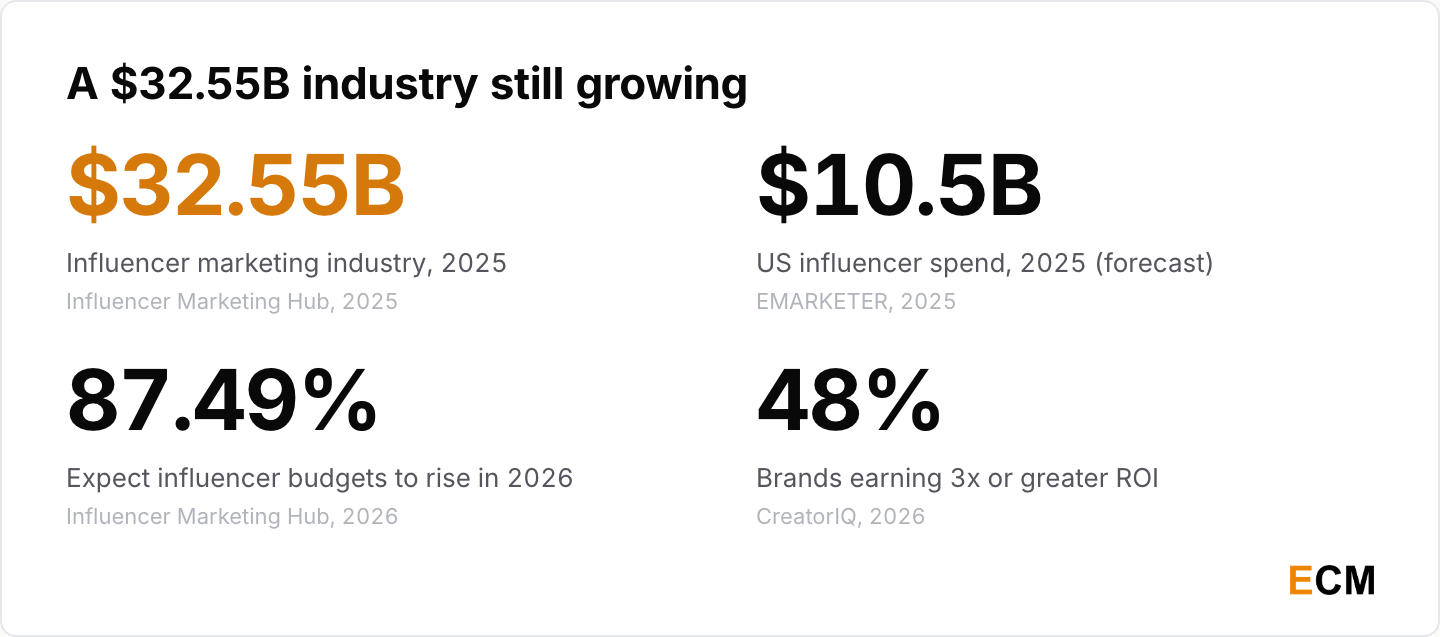
- The market keeps compounding. Influencer Marketing Hub puts the industry at $32.55 billion in 2025, nearly twice its $16.4 billion estimate for 2022 (Influencer Marketing Hub, 2026).
- US brands are spending more on creators. EMARKETER expects US influencer marketing spend of $10.5 billion in 2025, rising to $13.7 billion by 2027 (EMARKETER, 2025).
- Budgets are still going up. 87.49% of respondents expect their influencer marketing budget to increase in 2026, and only 5.55% expect a cut (Influencer Marketing Hub, Benchmark Report 2026, 2026).
- More brands report strong ROI. 48% of brands report earning 3x or greater ROI from creator marketing, up from 37% a year earlier (CreatorIQ, 2026).
- Small creators win on engagement. On TikTok, nano-influencers post a median engagement rate of 11.6%, against 6.8% for macro and mega accounts (HypeAuditor, State of Influencer Marketing 2026, 2026).
- Undisclosed deals cost trust. 70% of US consumers feel deceived when they discover a brand partnership that wasn’t disclosed (BBB National Programs, Influencer Trust Index, 2025).
Influencer Marketing Industry Size and Growth Statistics
Influencer Marketing Hub’s estimate grew about 19x between 2016 and 2025, and EMARKETER expects US brands to spend more than $10 billion on influencers in 2025.
How Big Is the Influencer Marketing Industry?
Influencer Marketing Hub’s estimate grew in every edition cited here, with the largest dollar jump between 2024 and 2025.
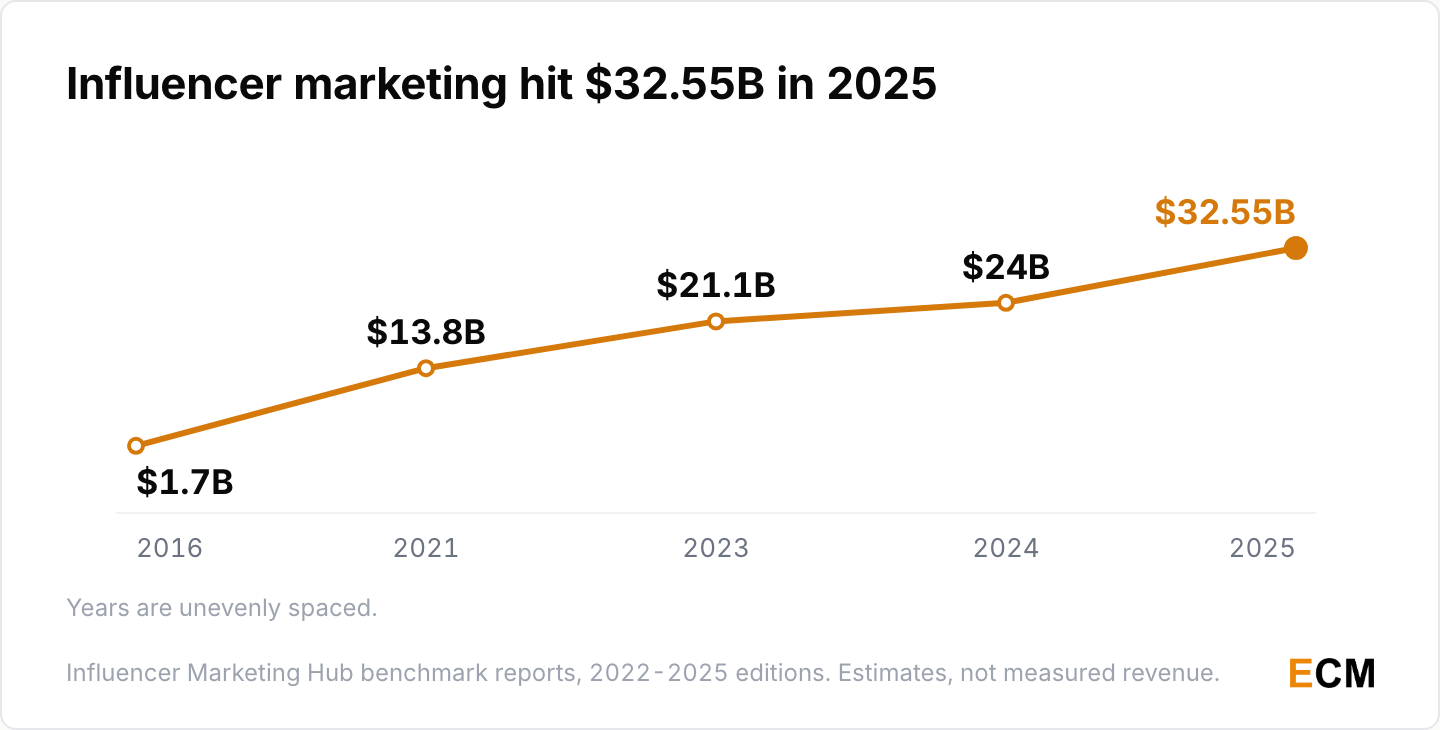
- Influencer Marketing Hub estimated the industry at $1.7 billion in 2016 and $13.8 billion in 2021 (Influencer Marketing Hub, Benchmark Report 2022, 2022), $21.1 billion in 2023 (Benchmark Report 2023, 2023), and $24 billion in 2024 and $32.55 billion in 2025 (Benchmark Report 2025, 2025).
- When this page first ran, HypeAuditor forecast growth from $13.8 billion in 2021 to $22.2 billion by 2025, a 12.6% CAGR (HypeAuditor, State of Influencer Marketing 2022, 2022). Its 2025 report projects $24 billion for 2025 and $31 billion by 2027 (HypeAuditor, State of Influencer Marketing 2025, 2025).
- Software platforms built for influencer marketing raised more than $800 million in 2021, led by LTK’s $300 million round (Influencer Marketing Hub, Benchmark Report 2022, 2022).
How Much Do US Brands Spend on Influencers?
EMARKETER’s estimates of US influencer spend, which count cash payments but not free products or trips, more than doubled between 2021 and 2025.
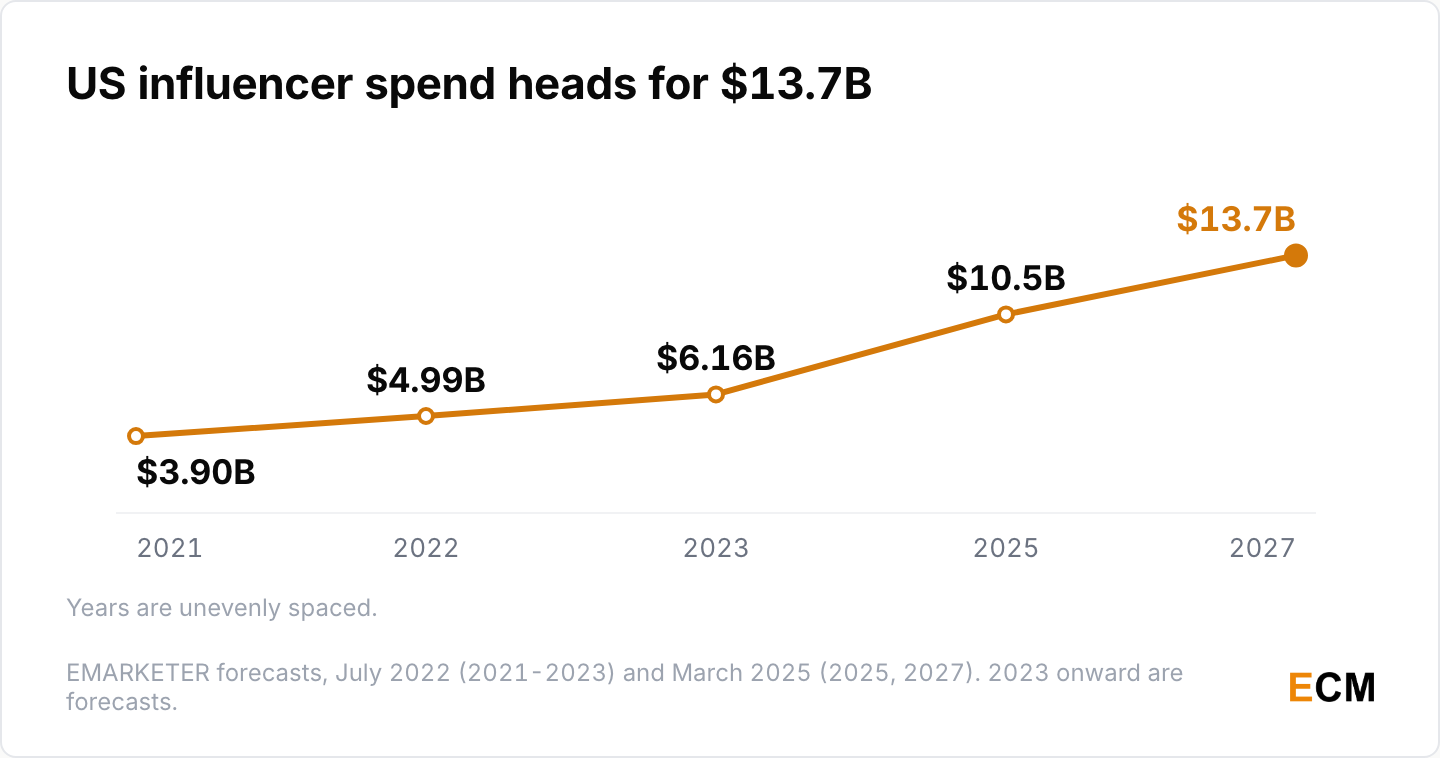
- EMARKETER’s July 2022 forecast put US influencer marketing spend at $3.90 billion in 2021 and $4.99 billion in 2022, rising 23.4% to $6.16 billion in 2023 (EMARKETER, Influencer Marketing Report 2022, 2022).
- Its March 2025 forecast has US brands spending $10.5 billion in 2025 and $13.7 billion by 2027 (EMARKETER, 2025). IAB’s separate measure of US creator ad spend is projected at $37 billion in 2025 and $44 billion in 2026 (IAB, Creator Economy Ad Spend and Strategy Report, 2025).
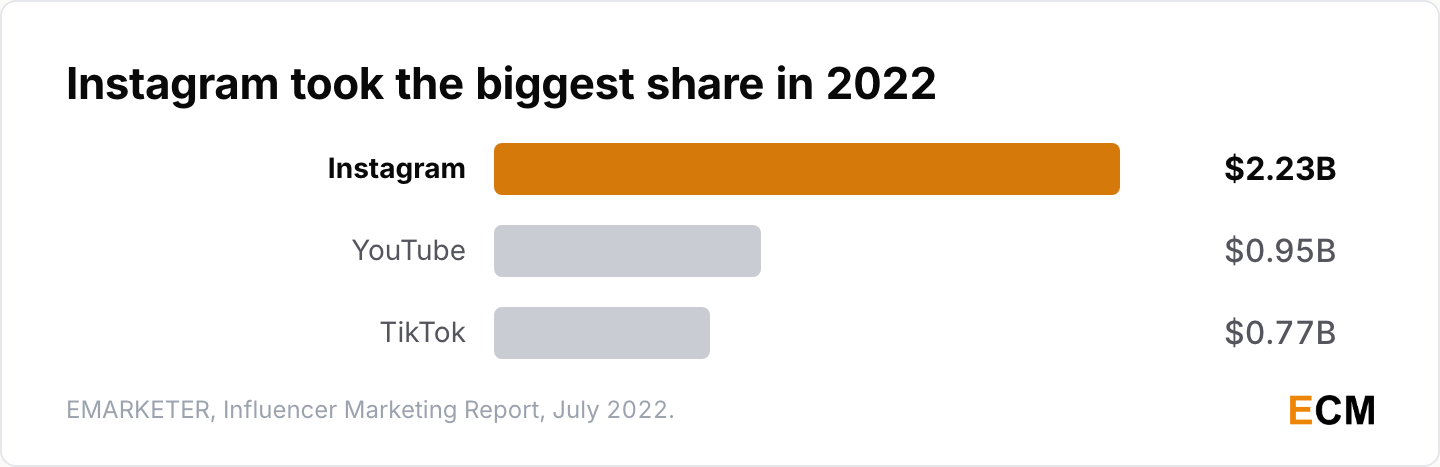
- Instagram took $2.23 billion of the $4.99 billion in 2022, ahead of YouTube ($0.95 billion) and TikTok ($0.77 billion) (EMARKETER, Influencer Marketing Report 2022, 2022). EMARKETER’s 2023 forecast has Instagram passing $2 billion in 2024 and TikTok, YouTube and Facebook each passing $1 billion (EMARKETER, 2023).
For the creator side of the same money, see my creator economy statistics.
Influencer Marketing Budget and Spending Statistics
Most surveyed brands run influencer partnerships, the most common budget is under $10,000, and most plan to spend more in 2026.
How Many Brands Use Influencer Marketing?
EMARKETER counted two in three US marketers using influencers in 2021, Sprout puts it at 86% for 2025, and B2B adoption more than doubled.
- EMARKETER’s May 2021 forecast put the share of US marketers using influencer marketing that year at 67.9% (EMARKETER, 2021); its July 2022 report put 2022 at 74.5% for marketers at companies with over 100 employees (EMARKETER, Influencer Marketing Report 2022, 2022).
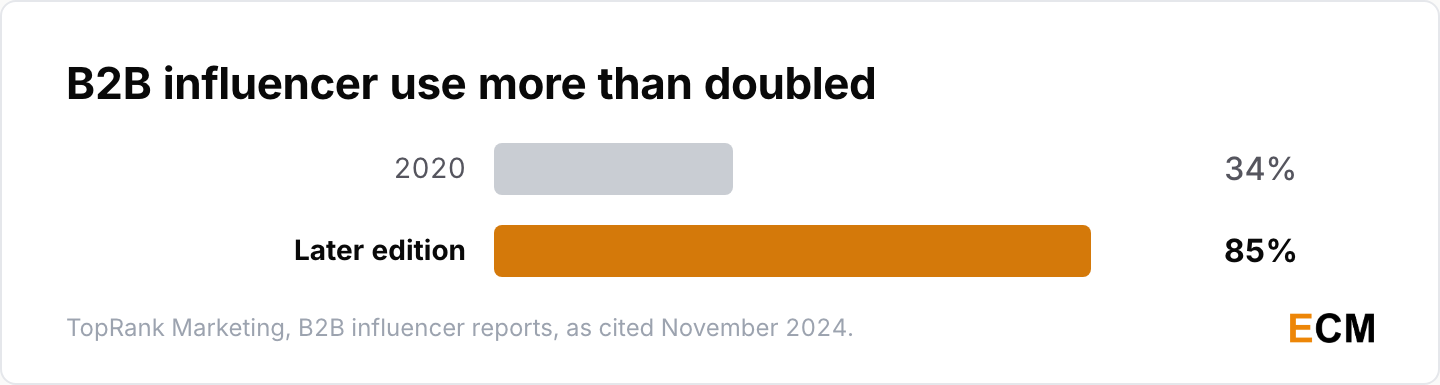
- 86% of US marketers partnered with influencers in 2025 (Sprout Social, 2026), and 85% of B2B marketers were using influencers, up from 34% in 2020 (TopRank Marketing, 2024).
How Much Do Companies Spend on Influencer Marketing?
In Influencer Marketing Hub’s 2023 survey, the most common annual influencer budget was under $10,000.
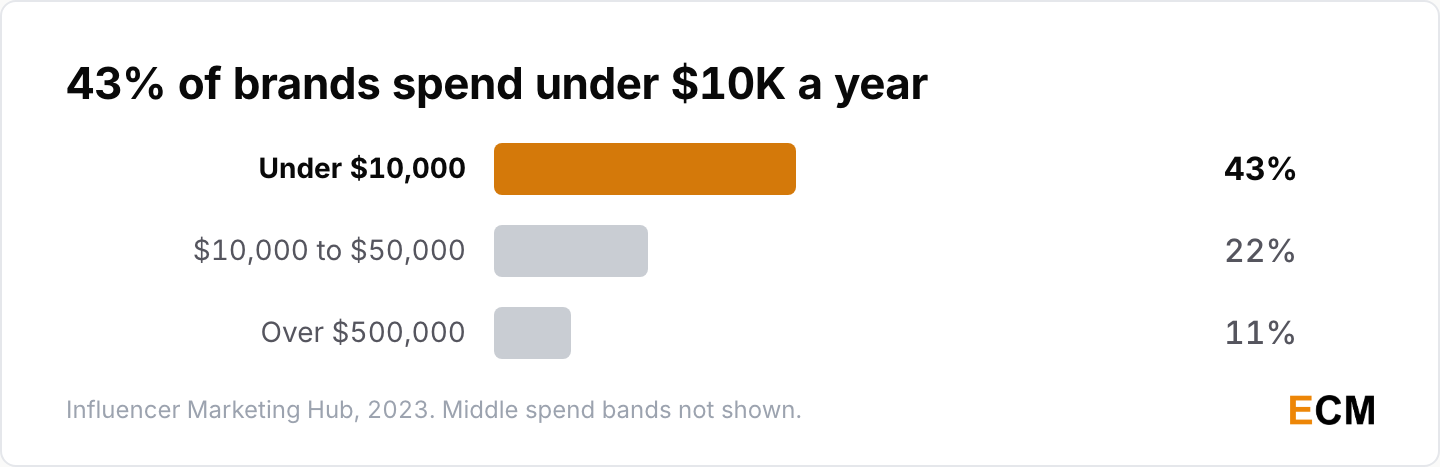
- 43% of brands spent less than $10,000 a year on influencer marketing, up from 37%; 22% spent $10,000 to $50,000 and 11% more than $500,000 (Influencer Marketing Hub, Benchmark Report 2023, 2023).
- 39% of respondents put 10-20% of their marketing budget into influencers in 2022; in 2023 that band fell to 25%, while 23% spent more than 40% (Influencer Marketing Hub, Benchmark Report 2023, 2023).
- Enterprises spent an average of $5.6 million to $8.1 million a year on creators in 2025, and industry leaders (brands spending $1 million or more with at least double the return) put 54% of their marketing budget into creators (CreatorIQ, 2025). In CreatorIQ’s separate 2026 survey, enterprise organizations invest $8.8 million a year on average, up 28% year over year (CreatorIQ, 2026).
Are Influencer Marketing Budgets Increasing?
Yes, and the 2026 intent numbers are the highest of the editions cited here, though I’d read them as appetite rather than committed spend.
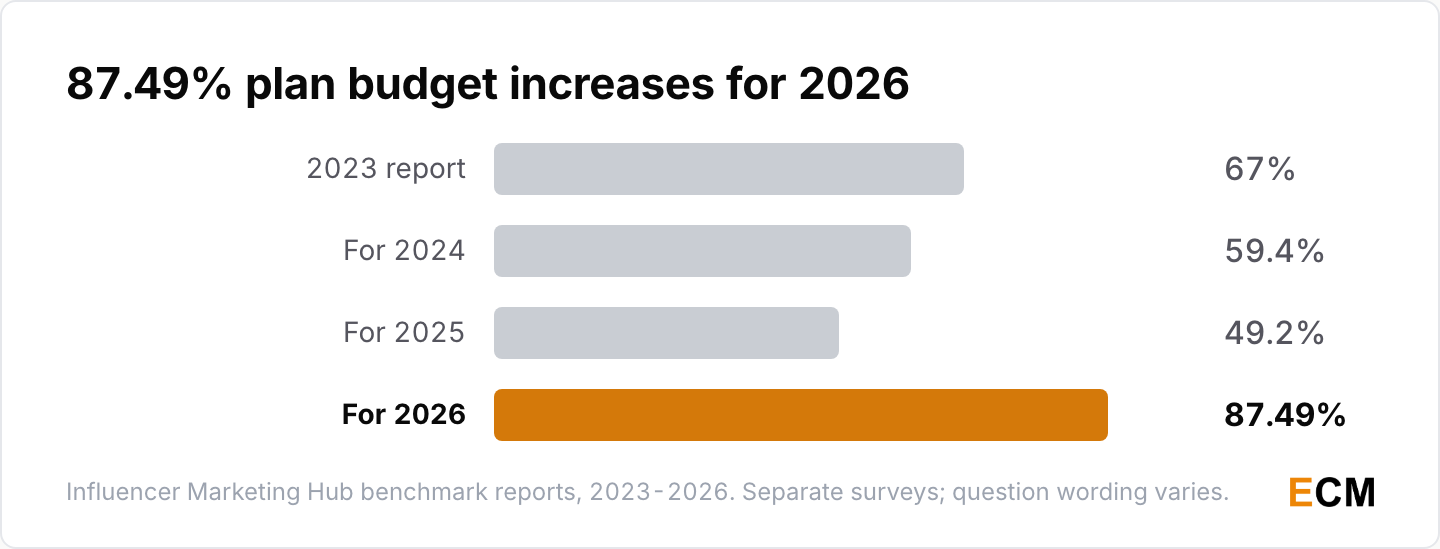
- 67% of brands that budget for influencer marketing intended to increase it over 2023, and 63% had a standalone budget for content marketing, up from 61% (Influencer Marketing Hub, Benchmark Report 2023, 2023).
- The share planning an increase fell from 59.4% for 2024 to 49.2% for 2025 (Benchmark Report 2025, 2025), and was 87.49% for 2026, with 72.22% expecting a rise of 50% or more (Benchmark Report 2026, 2026).
- 71% of organizations reported creator budget increases (CreatorIQ, 2025), 62% of enterprise marketers are increasing budgets in 2026 (Linqia, State of Influencer Marketing 2026, 2026), and 53% of B2B marketers say their influencer budget is growing (TopRank Marketing, 2025).
Influencer Marketing ROI and Measurement Statistics
More brands report strong returns, but many still judge campaigns on reach rather than sales, and proving ROI is still the sticking point.
What ROI Does Influencer Marketing Deliver?
Nearly half of brands now report a 3x return or better, though that figure is self-reported by brands in a creator platform’s survey, and separate surveys disagree on which platform delivers the best ROI.
- 48% of brands report earning 3x or greater ROI from creator marketing, up from 37% a year earlier (CreatorIQ, 2026). Influencer Marketing Hub counts the $236 billion in earned media value from 1.4 billion influencer posts in 2024 as an 8.4x return (Benchmark Report 2025, 2025).
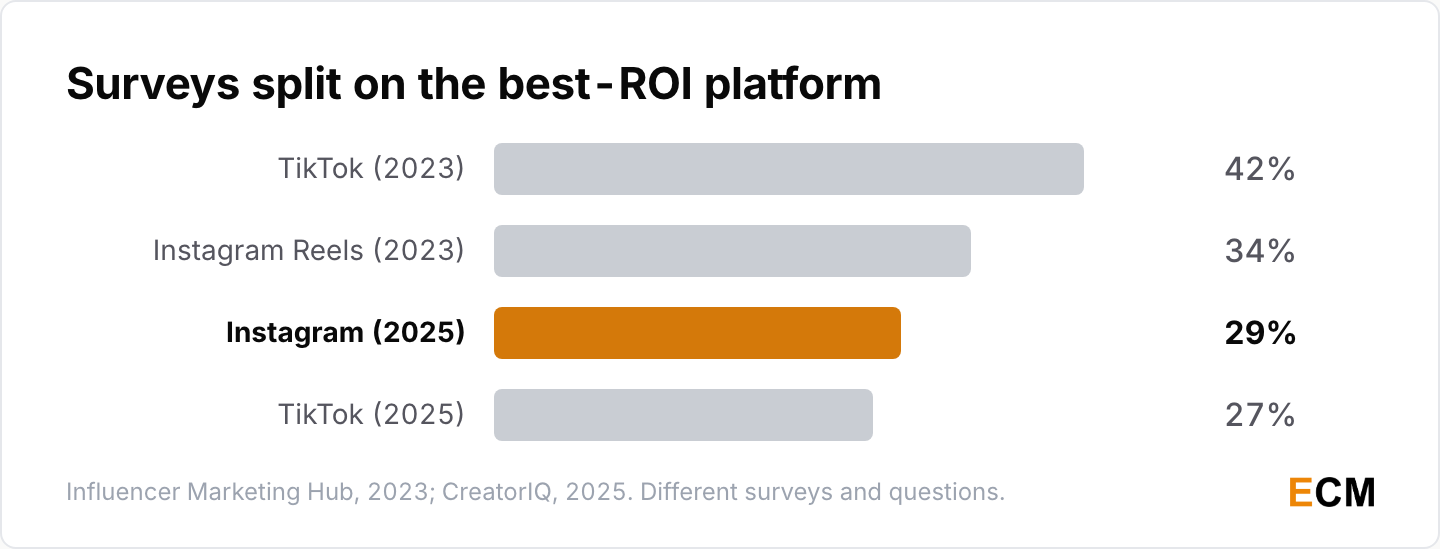
- In 2023, marketers picked TikTok (42%) and Instagram Reels (34%) as the best-ROI channels (Influencer Marketing Hub, Benchmark Report 2023, 2023). In CreatorIQ’s 2025 survey, Instagram drives the most ROI for 29% of brands and TikTok for 27% (CreatorIQ, 2025).
How Do Marketers Measure Influencer Campaigns?
In 2023, most influencer marketing campaigns were judged on reach and engagement, and fewer brands used sales as the main yardstick.
- 71% of brands measured the ROI of influencer campaigns in 2023, against 70% in 2022, 67% in 2021 and 65% in 2020 (Influencer Marketing Hub, Benchmark Report 2023, 2023).
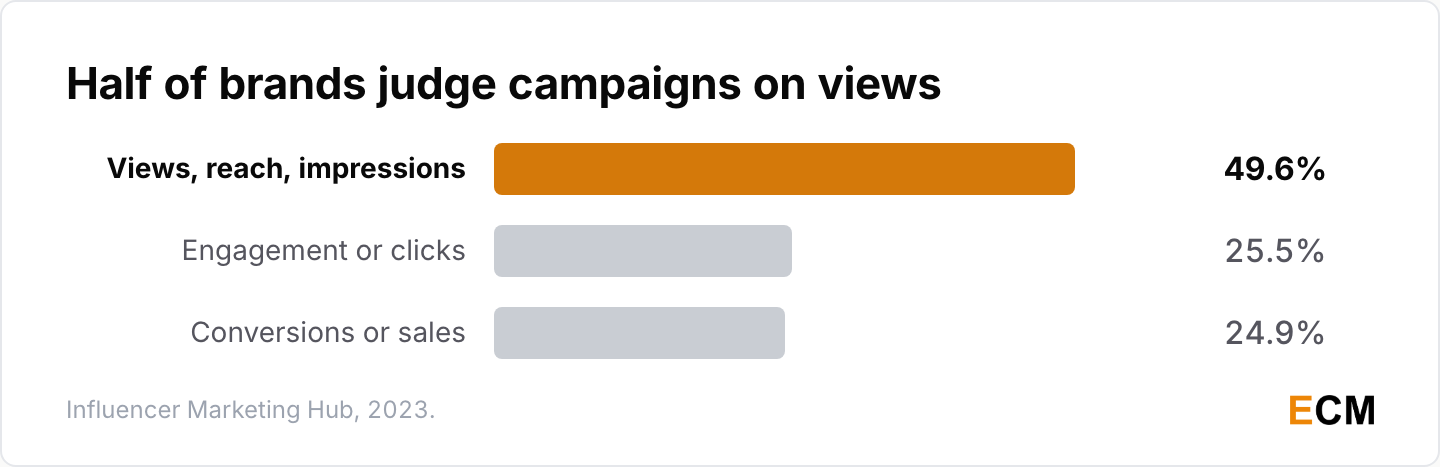
- 49.6% measured success by views, reach or impressions, 25.5% by engagement or clicks and 24.9% by conversions or sales, down from 42.3% for conversions a year earlier (Influencer Marketing Hub, Benchmark Report 2023, 2023).
- 83% favored earned media value as a measure of campaign ROI (Influencer Marketing Hub, Benchmark Report 2023, 2023). Today 40% of US creator ad buyers rank overall ROI as their top KPI (IAB, 2025).
- 65% of enterprise marketers named measuring programs to prove ROI as their top concern in 2021, in a survey of 163 enterprise marketers and agency professionals at companies with over $1 billion in revenue (Linqia, State of Influencer Marketing 2021, 2021). Now 79% struggle to measure ROI and 48% cite attribution as the biggest gap (Linqia, State of Influencer Marketing 2026, 2026).
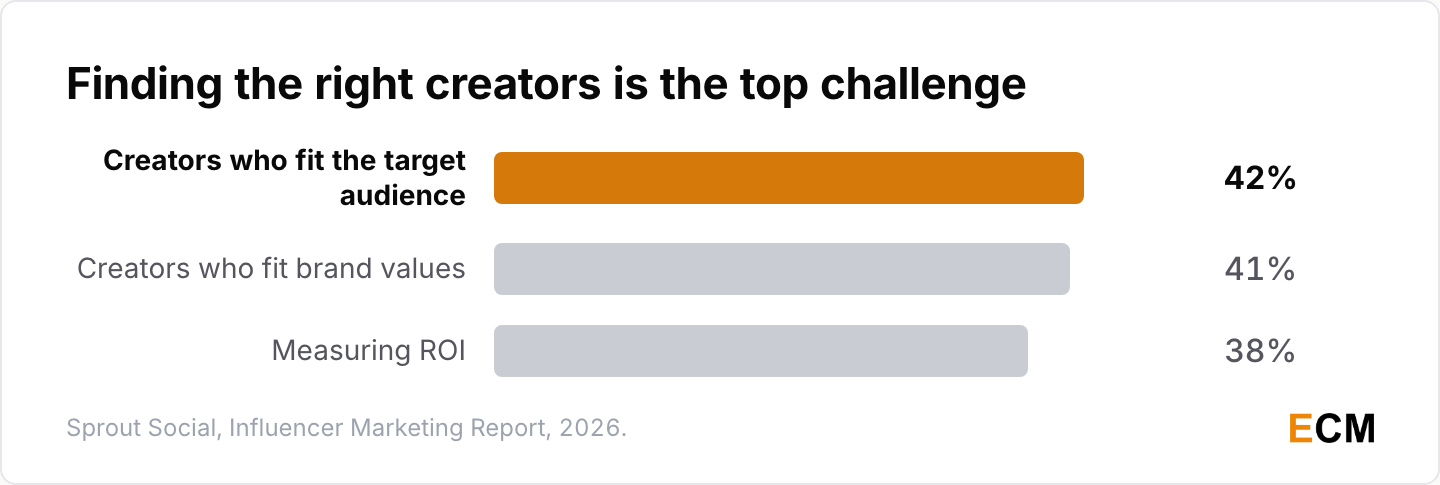
- Finding creators who fit their target audience (42%) and brand values (41%) are companies’ top challenges, measuring ROI (38%) ranks third, and only 24% design campaigns around revenue outcomes (Sprout Social, Influencer Marketing Report, 2026).
If you track creator posts alongside your own social accounts, see the Sprout Social review.
What Goals Do Influencer Campaigns Serve?
Sales overtook UGC as the main campaign goal between 2023 and 2025, and most brands still run programs in-house.
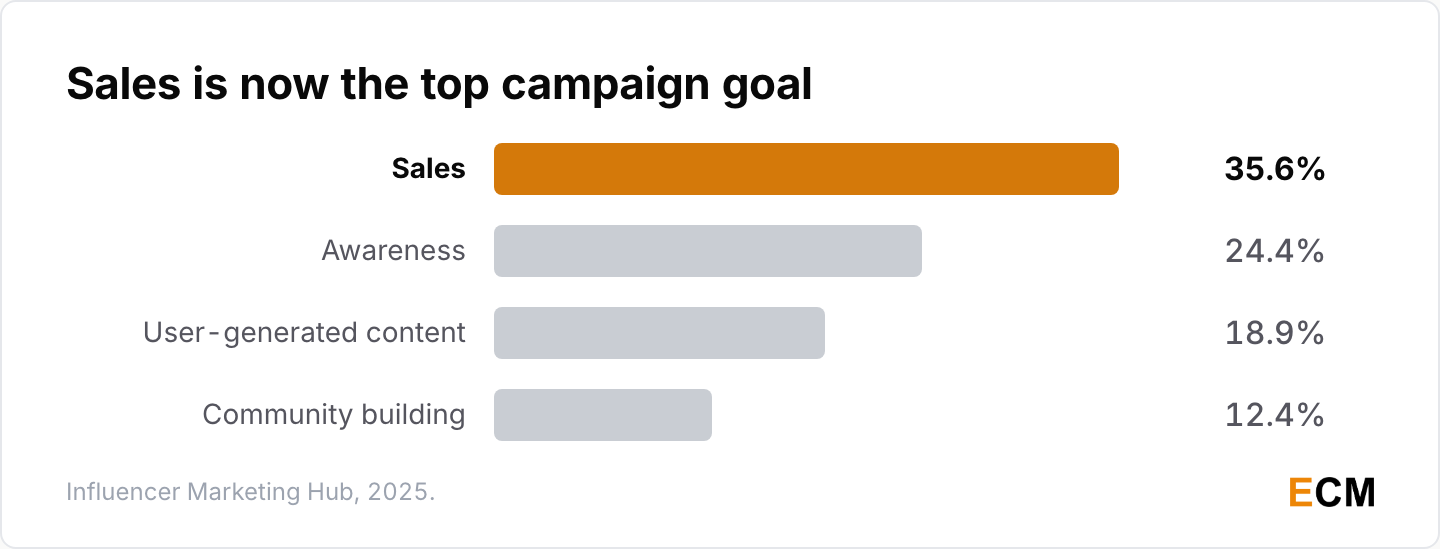
- User-generated content was the main campaign objective for 45% of respondents in 2023 (Benchmark Report 2023, 2023). By 2025 sales led at 35.6%, ahead of awareness (24.4%), UGC (18.9%) and community building (12.4%) (Benchmark Report 2025, 2025).
- In 2023, 74% of brands tracked sales from influencer campaigns, 82% said influencer marketing brings better-quality customers and 72% ran it in-house (Influencer Marketing Hub, Benchmark Report 2023, 2023).
- In 2022, 49.9% of respondents used influencer marketing tools developed in-house (Benchmark Report 2022, 2022), and 66.3% run programs entirely in-house in 2026 (Benchmark Report 2026, 2026).
B2B Influencer Marketing Statistics
B2B teams rate their influencer programs highly, and always-on programs rated best in TopRank’s 2025 data.
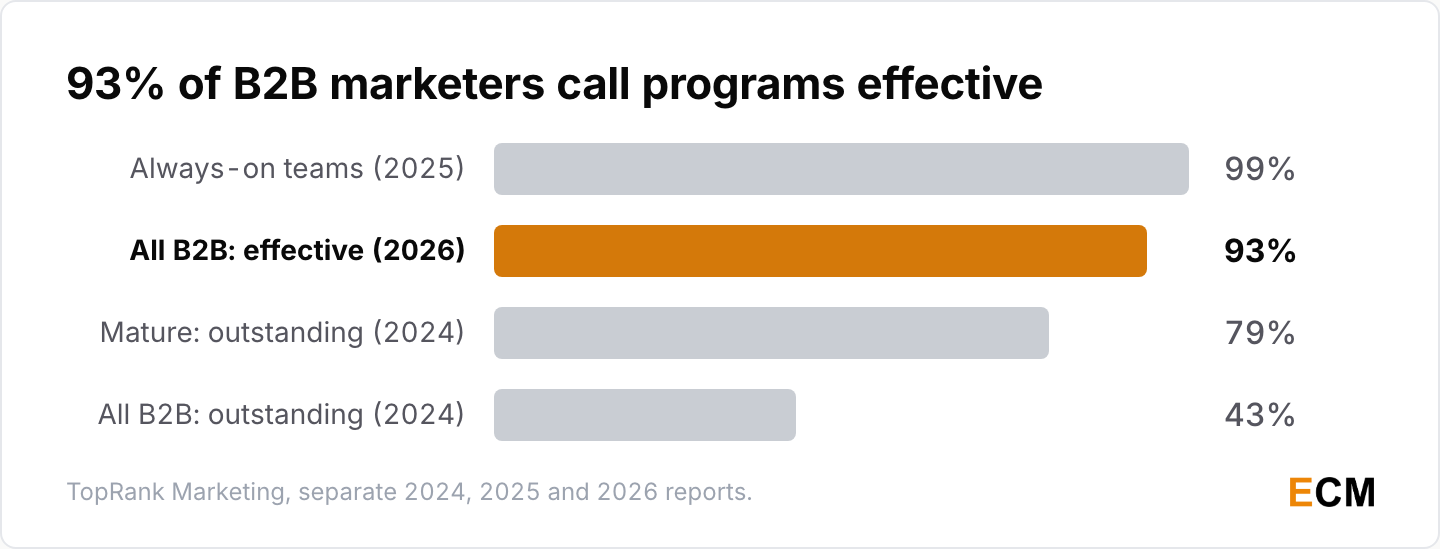
- 93% of B2B marketers rate their influencer programs effective, though less than half call them very effective, in a survey of 400+ senior B2B marketers (TopRank Marketing, B2B Influencer and Creator Marketing Report, 2026).
- In TopRank’s report published in late 2024, 43% reported outstanding results, rising to 79% for mature programs (TopRank Marketing, 2024).
- 99% of B2B teams using an always-on approach rate their programs effective, and 58% of teams use one (TopRank Marketing, 2025). Brands that tie influencer marketing to AI search are nearly twice as likely to be cited by AI, 48% against 26% for the rest (TopRank Marketing, 2026).
For the wider B2B picture, see my B2B content marketing statistics and LinkedIn statistics.
Influencer Marketing Statistics by Social Media Platform
Instagram and TikTok still lead, nano creators get the best engagement, and brands plan to grow small-creator rosters fastest.
Which Platforms Do Brands Use for Influencer Marketing?
TikTok led brand usage in 2023, Instagram led as the preferred channel in 2025, and TikTok tops 2026 investment plans.
- Instagram was used by 79% of brands running influencer marketing in 2022 (Benchmark Report 2022, 2022). TikTok took first place in 2023, used by 55.5% of brands against 50.8% for Instagram (Benchmark Report 2023, 2023).
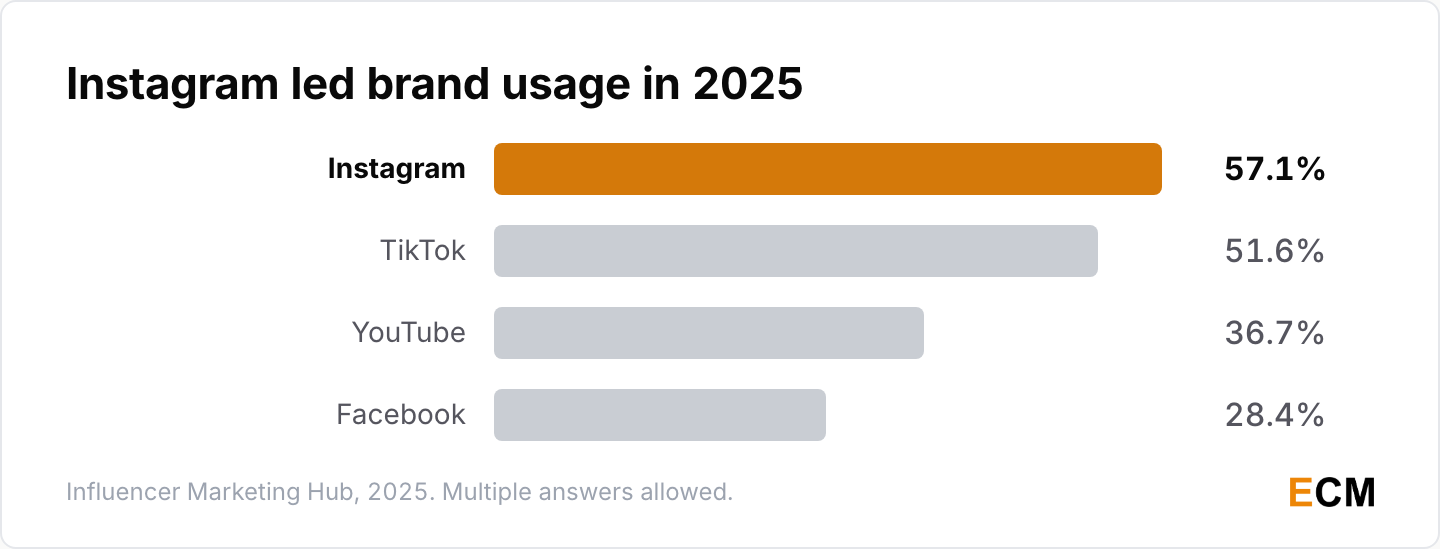
- In 2025, Instagram (57.1%) and TikTok (51.6%) led, followed by YouTube (36.7%) and Facebook (28.4%) (Influencer Marketing Hub, Benchmark Report 2025, 2025).
- TikTok appears in 31% of respondents’ 2026 influencer plans, the most-selected platform (Influencer Marketing Hub, Benchmark Report 2026, 2026).
- 56% of marketers say YouTube videos are the most important content type for influencer marketing, and 68% consider Instagram important (HypeAuditor, 2025).
For platform-level numbers beyond influencers, see my YouTube statistics and video marketing statistics.
Influencer Engagement Rates by Follower Tier
The smaller the account, the higher the engagement, on TikTok and Instagram, in both the 2023 and 2026 reports.
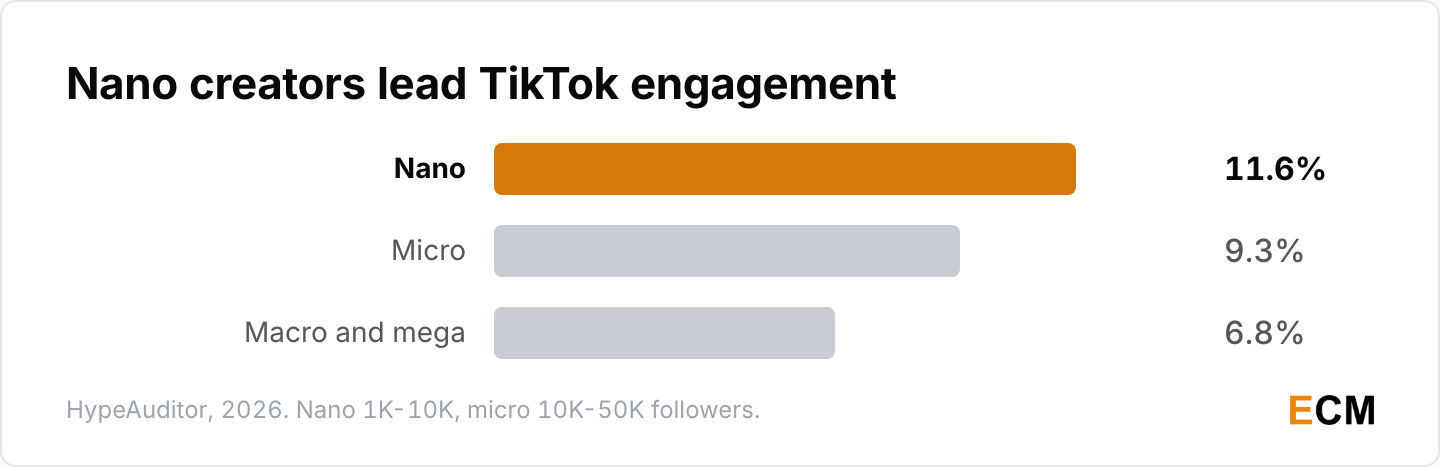
- TikTok accounts with 1,000 to 5,000 followers averaged 15.04% engagement, against 10.53% for accounts over 1 million (Benchmark Report 2023, 2023). TikTok nano-influencers now post a median 11.6%, micro 9.3%, and macro and mega 6.8% (HypeAuditor, State of Influencer Marketing 2026, 2026).
- Instagram engagement ran from 4.21% for accounts under 5,000 followers to 0.95% for those over 100,000 (Benchmark Report 2023, 2023). Nano influencers now hold the highest median at 1.79%, against 0.33% to 0.35% for macro and mega (HypeAuditor, 2026).
Nano and Micro Influencers Lead Brand Plans
Creators with a following under 10,000 are the overwhelming majority of influencers, and far more brands plan to expand nano and micro work than macro.
- Accounts with 1,000 to 10,000 followers make up 81.5% of Instagram influencers, 88.7% of TikTok creators and 76.1% of YouTube creators (HypeAuditor, State of Influencer Marketing 2026, 2026).
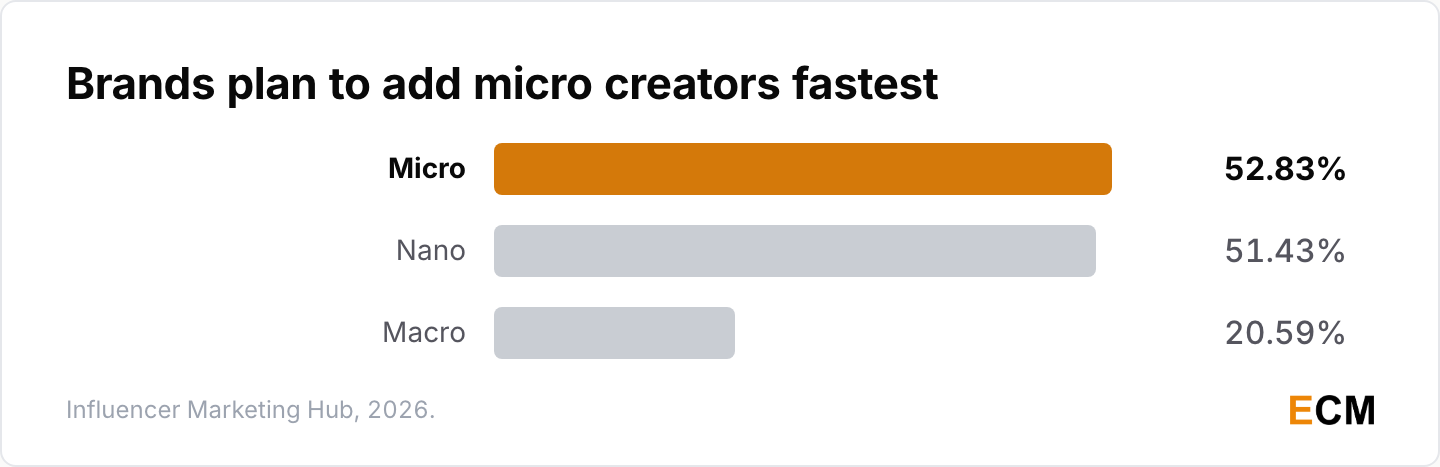
- In 2021, 90% of enterprise marketers wanted to work with micro-influencers, and micro ranked first for planned budget with a score of 6.4 (Linqia, State of Influencer Marketing 2021, 2021). For 2026, 52.83% of Influencer Marketing Hub respondents plan to expand micro creator work and 51.43% nano, against 20.59% for macro (Benchmark Report 2026, 2026).
- Lifestyle was the most common Instagram influencer niche in 2020, 2021 and 2022 (Benchmark Report 2023, 2023). HypeAuditor’s 2026 Instagram categories, which group topics differently, put entertainment first at 8.0%, ahead of shopping and fashion (7.1%) (HypeAuditor, 2026).
If you’re picking a discovery tool to find these creators, see the Modash review.
Who Uses TikTok for Influencer Content?
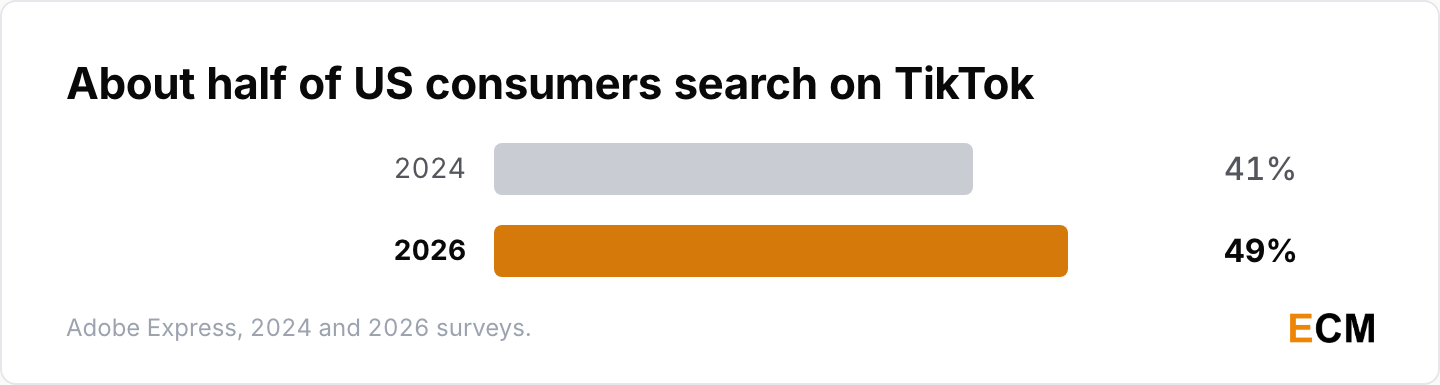
TikTok’s audience skews young and slightly female, and about half of US consumers now search on it.
- Women aged 18 to 24 were 24.27% of TikTok’s audience in 2023, the largest single age and gender group (Benchmark Report 2023, 2023). Users under 24 now make up 38.7% of TikTok’s global audience, which is 51.4% female (HypeAuditor, 2026).
- 65% of US adults aged 18 to 29 use TikTok, against 11% of those 65 and older (Pew Research Center, 2026), and 49% of US consumers used TikTok as a search engine in 2026, up from 41% in 2024 (Adobe Express, 2026).
Consumer Trust and Influencer Purchase Behavior Statistics
Most consumers have bought something because a creator recommended it, but they trust influencer content less than ads and punish hidden sponsorships.
Do Influencers Drive Consumer Purchases?
Most consumers make at least one influencer-inspired purchase a year, though far fewer say influencers make them more likely to buy.
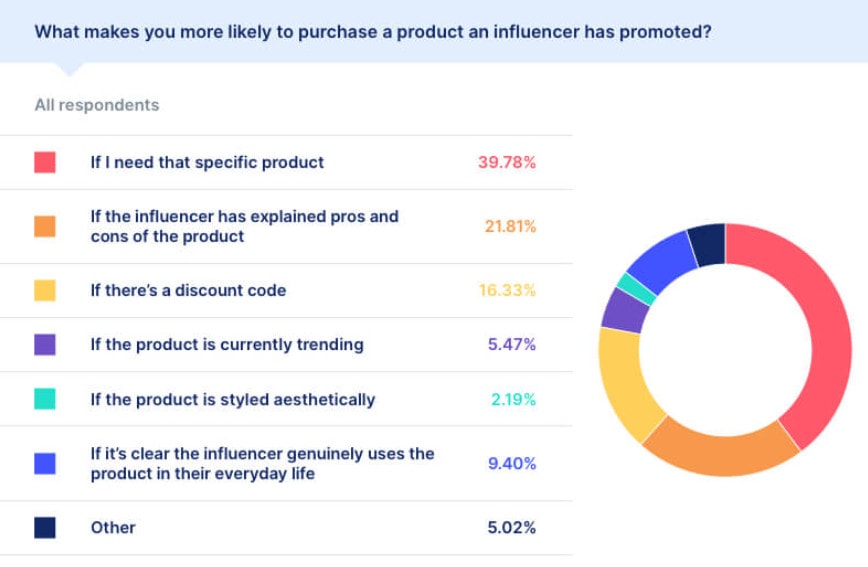
- 82% of marketers believed influencers drive purchases, while 26% of consumers said influencers make them more likely to buy, in a July 2021 survey of 250 US marketers and 1,000 US consumers (RRD, 2021). Nearly 40% said feeling they “need” the product is what most likely convinces them (SlickText, 2021).
- Almost 80% of consumers surveyed said social media directly affects their purchases, and more than 95% had bought items on Instagram or Facebook (GRIN, 2021).
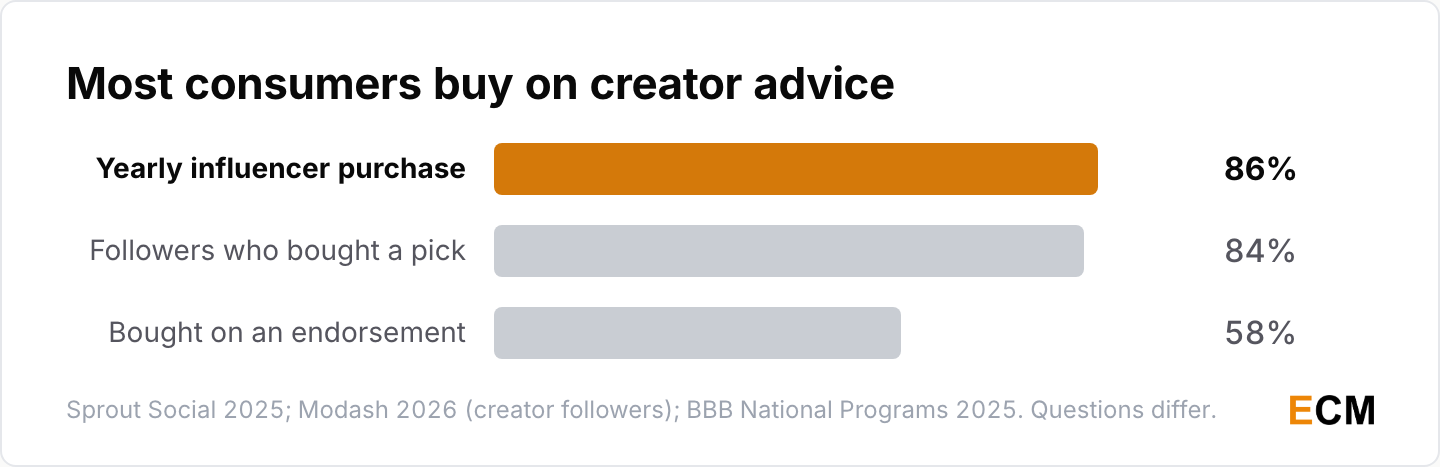
- 86% of consumers make at least one influencer-inspired purchase a year, and influencer content drives 49% of their daily, weekly or monthly purchases (Sprout Social, 2025).
- 58% of US consumers have bought because of an influencer endorsement (BBB National Programs, 2025), and 84% of US adults who follow creators have bought something a creator recommended (Modash, Creator Trust Report 2026, 2026).
How Much Do Consumers Trust Influencers?
Trust in influencer content trails trust in ads, and consumers care more about honesty than follower count.
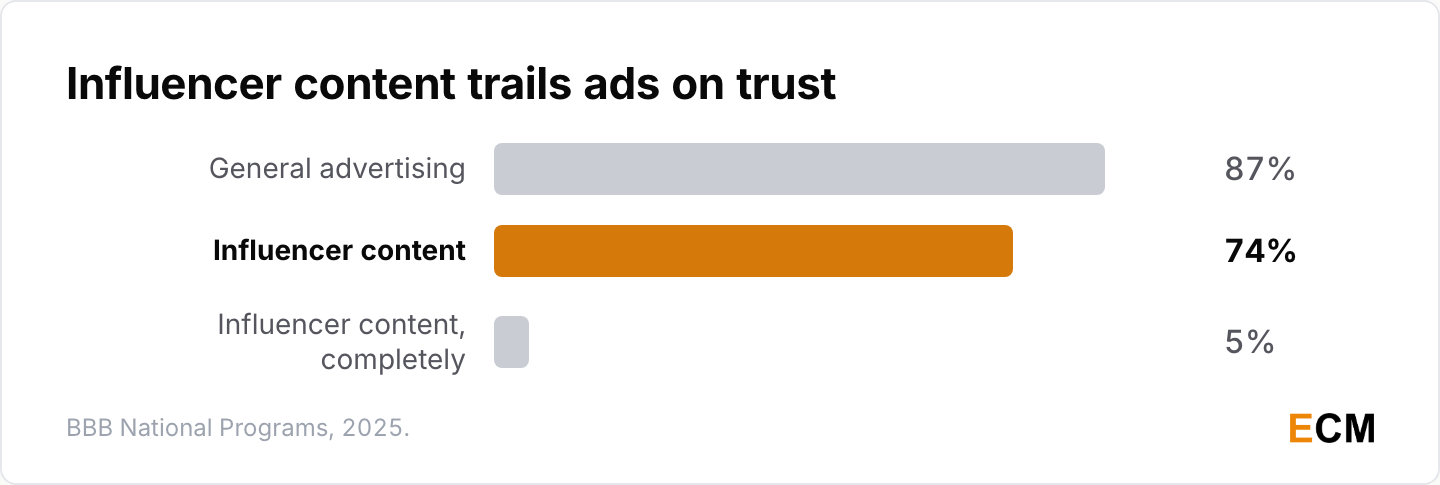
- 74% of US consumers trust or somewhat trust influencer content, against 87% for general advertising, and only 5% trust influencer content completely (BBB National Programs, 2025).
- 54% of consumers said follower count does not affect their willingness to buy what an influencer promotes (GRIN, 2021), and 67% now say being honest and unbiased is what makes the best brand and influencer collaborations (Sprout Social, 2025).
For how shoppers weigh customer reviews, see my online review statistics.
Why Sponsorship Disclosure Matters
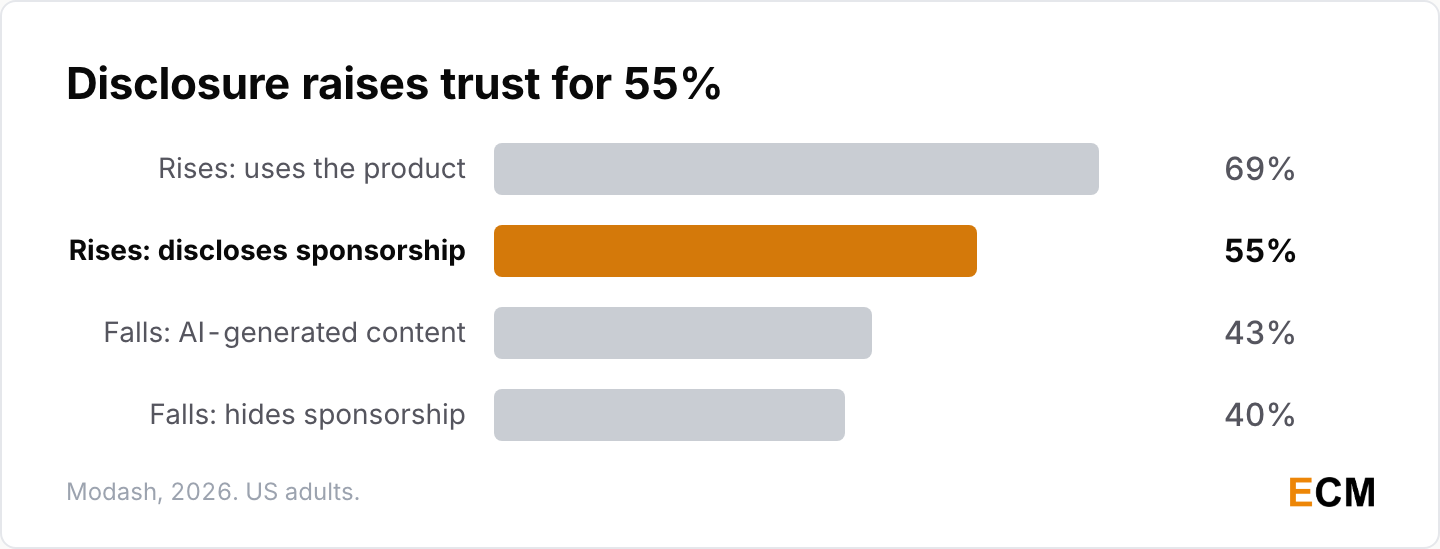
Hiding a paid partnership costs trust, while clear disclosure and visible product use raise it.
- Nearly 70% of consumers were bothered when an influencer didn’t say a brand sponsored a post (GRIN, 2021). Now 70% of US consumers feel deceived when they discover an undisclosed partnership, and 64% rank failure to disclose as a trust killer (BBB National Programs, 2025).
- Trust rises when a creator appears to use the product (69%) or clearly discloses the sponsorship (55%), and falls when a creator uses AI-generated content (43%) or hides the sponsorship (40%) (Modash, 2026).
Social Commerce Statistics
EMARKETER expects US social commerce to pass $100 billion in 2026, after TikTok Shop took 18.2% of it in 2025.
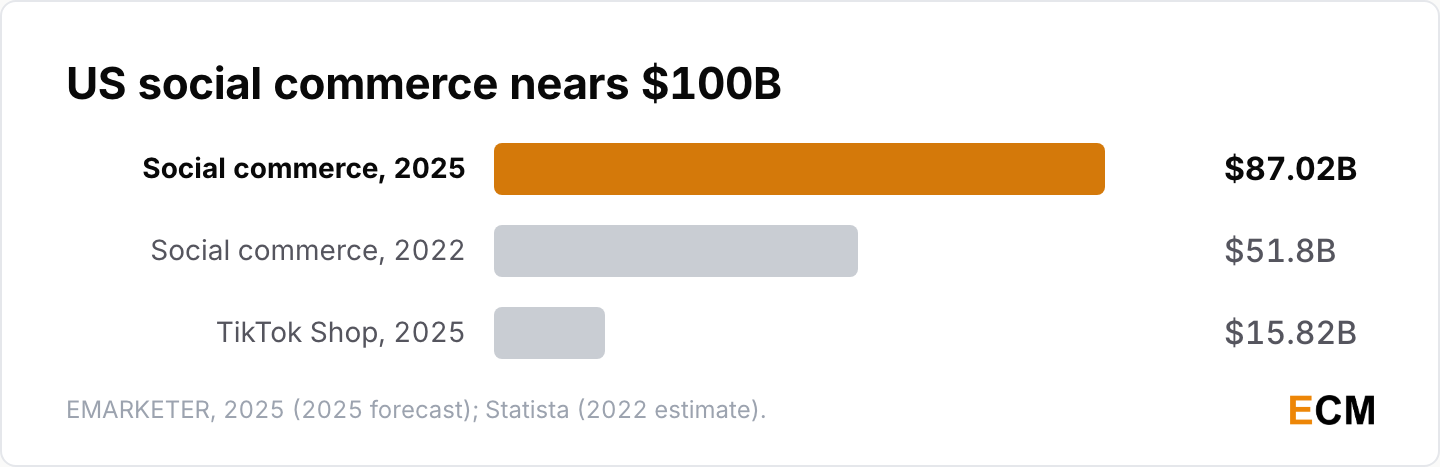
- US social commerce sales were estimated at nearly $51.8 billion in 2022, a 4.4% share of online retail (Statista, 2023).
- EMARKETER forecasts US social commerce sales of $87.02 billion in 2025, up 21.5%, passing $100 billion in 2026; TikTok Shop’s US sales reach $15.82 billion in 2025, 18.2% of the total (EMARKETER, 2025).
- Research and Markets projected the global social commerce market to grow from $992.4 billion in 2022 to $8.5 trillion by 2030 (Research and Markets, 2023). Grand View Research sizes it at $1,484.5 billion in 2025 (Grand View Research, 2026).
- Shopify’s case study first credited influencer-led teeth-whitening brand HiSmile with more than $130 million in total sales (Shopify, 2022); the page now reports $300 million in annual revenue for 2023 (Shopify, 2023).
- 45% of US consumers aged 35 to 44 had bought a product promoted by a virtual influencer in a March 2022 survey (Statista, 2022), yet 89% of enterprise marketers still avoid virtual influencers, even though 74% use AI (Linqia, 2026).
If your program pays creators on commission, my affiliate marketing statistics cover that side, and my digital marketing statistics put influencer spend next to other channels.
Influencer Burnout, Pay Gap and Diversity Statistics
Most creators have burned out at some point, pay still splits along gender and race, and the typical creator earns little.
How Common Is Influencer Burnout?
Each burnout survey cited here finds more than half of creators have burned out, and a 2025 survey found more than a third considering quitting. The samples differ, so read each figure on its own rather than as a trend.
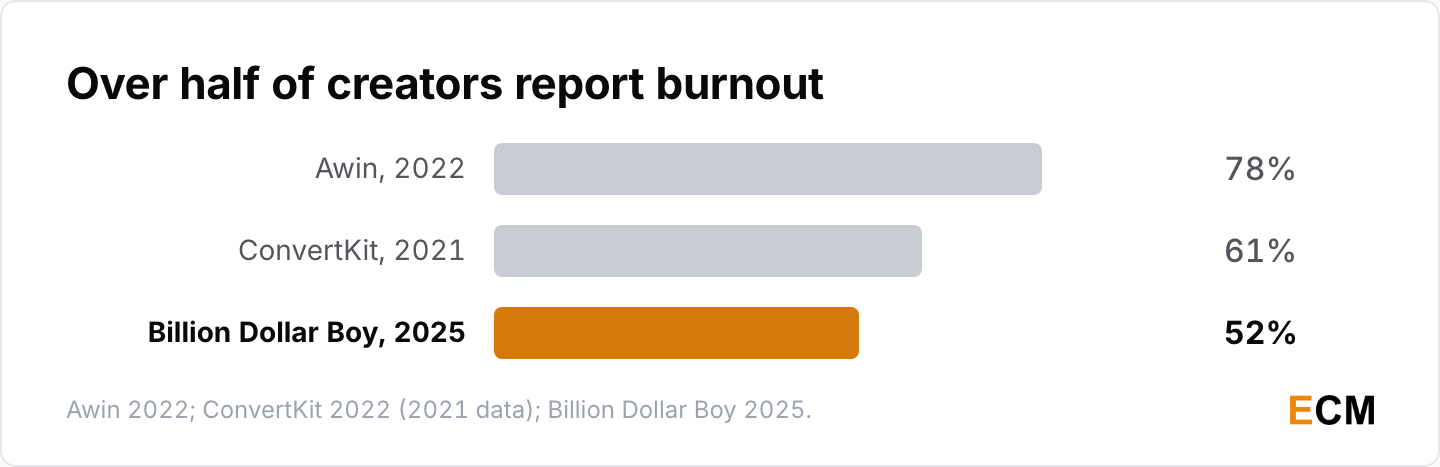
- 61% of creators experienced burnout in 2021, in a survey of 2,704 creators; among full-time creators the leading cause was the pressure to post everywhere, and 74.11% of full-time influencers reported burnout (ConvertKit, State of the Creator Economy 2022, 2022).
- 51% of respondents in Vibely’s creator burnout report, which drew on 150 influencer interviews, named anxiety about follower count as one of the most taxing causes of burnout (Net Influencer, 2022).
- Awin found 78% of the UK and US influencers on its platform admit to suffering burnout, 71% of those on Instagram experience it, and 72% cite constant platform changes as the leading cause of anxiety (Awin, 2022).
- 52% of US and UK creators have burned out because of their career, and 37% have considered leaving (Billion Dollar Boy, 2025).
For burnout outside the creator economy, see my workplace burnout statistics.
The Influencer Gender and Racial Pay Gap
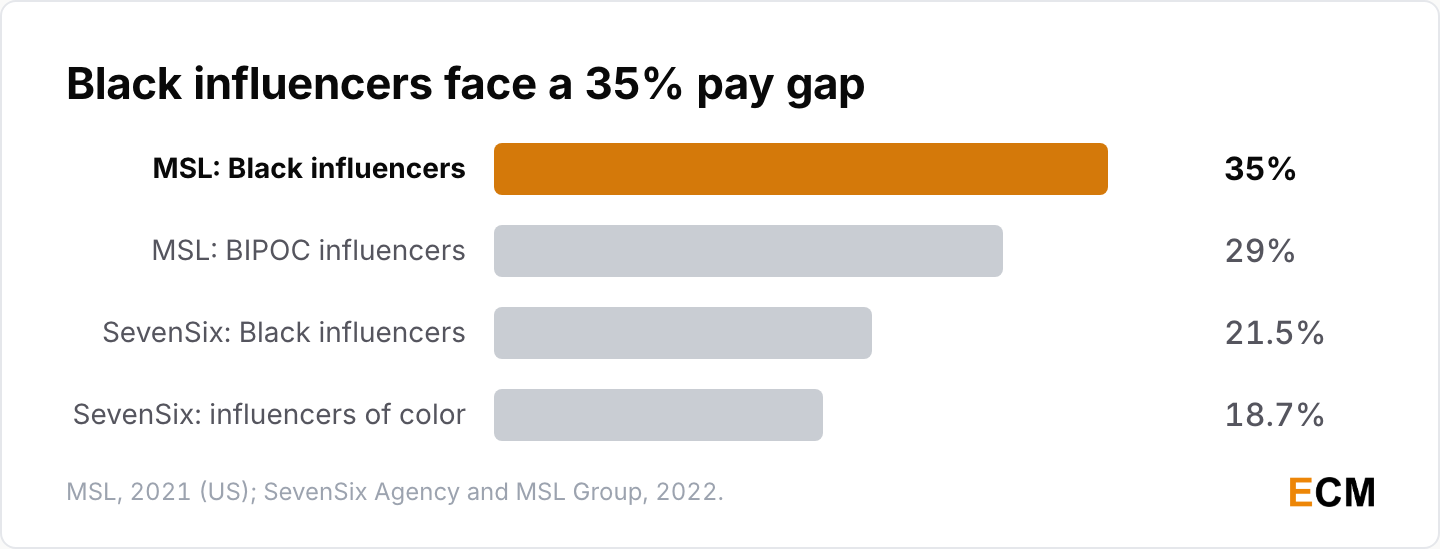
Men still earn more per deal than women on the marketplaces measured, more than half of influencers report discrimination, and MSL found a 35% white-Black pay gap.
- In a 2022 survey of more than 2,000 influencers, 58.3% said they had faced discrimination, gender was the most-cited type at 47.73% of reports, and macro (81.25%) and mega-influencers (69.7%) were the most likely to report it (Influencer Marketing Hub, DEI in Influencer Marketing, 2022).
- On IZEA’s marketplace, brands paid male influencers an average of $2,978 per post across platforms in 2021, against $2,289 for women, but women earned more on Instagram Stories, $962 against $609 (IZEA, State of Influencer Equality 2022, 2022).
- White influencers took 57% of IZEA’s sponsorship deal flow, below their 58% share of the US population for the first time (IZEA, State of Influencer Equality 2022, 2022).
- On Collabstr, male creators earned $205 per engagement in 2025 against $166 for women, down from $291 and $208 a year earlier (Collabstr, 2026 Influencer Marketing Report, 2026).
- The pay gap between white and BIPOC influencers is 29%, widening to 35% between white and Black influencers; 77% of Black influencers sit in the nano and micro tiers, where brand pay averaged $27,000 a year, against 59% of white influencers (MSL, 2021).
- A 2022 SevenSix Agency and MSL Group report found an 18.7% pay gap between white influencers and influencers of color, rising to 21.5% for Black influencers (SevenSix Agency, Influencer Pricing Report, 2023).
How Much Do Influencers Earn?
Most creators earn very little from content, even as the market around them has more than doubled.
- Influencer Marketing Hub estimated the creator economy at $104.2 billion with more than 50 million creators in 2021 (Creator Earnings Benchmark 2021, 2021) and calls it a $250 billion industry in 2025, where more than half of creators earn under $15,000 a year (Creator Earnings Report 2025, 2025).
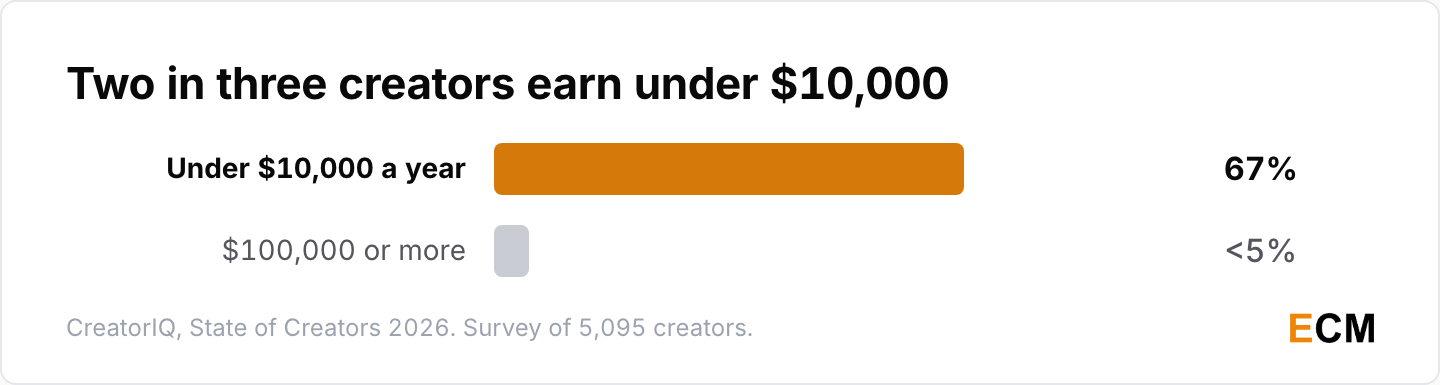
- 67% of creators earned less than $10,000 a year and just under 5% cleared $100,000, in a survey of 5,095 creators in 100 countries (CreatorIQ, State of Creators 2026, 2026).
Frequently Asked Questions
How big is the influencer marketing industry?
Influencer Marketing Hub estimates $32.55 billion in 2025, up from $24 billion in 2024 (Influencer Marketing Hub, 2025). In the US, EMARKETER expects $10.5 billion in 2025 (EMARKETER, 2025).
How much do companies spend on influencer marketing?
In 2023, 43% of brands spent under $10,000 a year and 11% spent over $500,000 (Influencer Marketing Hub, 2023). Enterprise organizations now invest an average of $8.8 million a year on creators, up 28% year over year (CreatorIQ, 2026).
What was the success rate of influencer marketing in 2023?
Over 83% of respondents believed influencer marketing was effective in 2023 (Influencer Marketing Hub, 2023), and EMARKETER forecast US influencer spend would grow 23.4% to $6.16 billion that year (EMARKETER, 2022). Today, 48% of brands report 3x or greater ROI (CreatorIQ, 2026).
Which industry uses influencer marketing the most?
Fashion and beauty. InfluencerDB data put 30% of influencer marketing in those verticals, and Fashion Nova earned $588 million in earned media value in 2018 (Retail TouchPoints, 2019). Fashion and beauty was still the biggest respondent vertical in 2023, at 25% (Influencer Marketing Hub, 2023).
Which platform is best for influencer marketing?
Instagram and TikTok. Instagram was the most preferred channel in 2025 at 57.1%, with TikTok at 51.6% (Influencer Marketing Hub, 2025), and 29% of brands say Instagram drives their best ROI (CreatorIQ, 2025).
Is influencer marketing better than paid ads?
Affable’s blog put influencer returns at $18 per $1 spent, against $4 for ads (Affable, 2022). 81% of enterprise marketers say influencer content outperforms brand-created assets (Linqia, 2026). I’d run both and put the best creator posts behind paid spend.
What are the KPIs for influencers?
Engagement was the most common KPI in 2021, used by 77% of enterprise marketers (Linqia, 2021). Separately, 40% of US creator ad buyers rank overall ROI as their top KPI (IAB, 2025).
How is AI changing influencer marketing?
Only 10.56% of respondents say they don’t use AI in influencer marketing, and creator discovery is the top use at 36.67% (Influencer Marketing Hub, 2026). On the audience side, 43% trust a creator less when they use AI-generated content (Modash, 2026).
Written by
Editorial Staff
The Editorial Staff represents the writers, editors, and content creators who have worked (or work) at Elite Content Marketer. The experimenter-in-chief behind the team is Chintan Zalani, who has close to a decade of experience trying to make sense of the content marketing industry. Started in 2019, Elite Content Marketer is on a mission to help creators build sustainable businesses.
Related Articles

Marketing Data
Career Change Statistics 2026: 59 Facts That Matter
59 career change statistics for 2026: how often people switch careers, why they do it, the average age, what it pays and what stops them.
Nov 9, 2026Read more →

Marketing Data
EdTech Market Statistics 2026: 60 Funding and AI Facts
60 edtech market statistics for 2026: market size, venture funding, Duolingo and Coursera results, school device use, AI adoption and cybersecurity data.
Nov 3, 2026Read more →
Marketing Data
Branding Statistics 2026: 60 Facts You Need to Know
60 branding statistics for 2026: brand value rankings, trust and authenticity, user-generated content, social media, loyalty and B2B branding data.
Nov 2, 2026Read more →