U.S. internet advertising revenue hit a record $294.6 billion in 2025, up 13.9% (IAB/PwC Internet Advertising Revenue Report, April 2026). These digital marketing statistics show the money moving faster than the proof that AI spend pays.
57 Digital Marketing Statistics for 2026: Ad Spend + AI
 Written by Editorial Staff
Key Takeaways
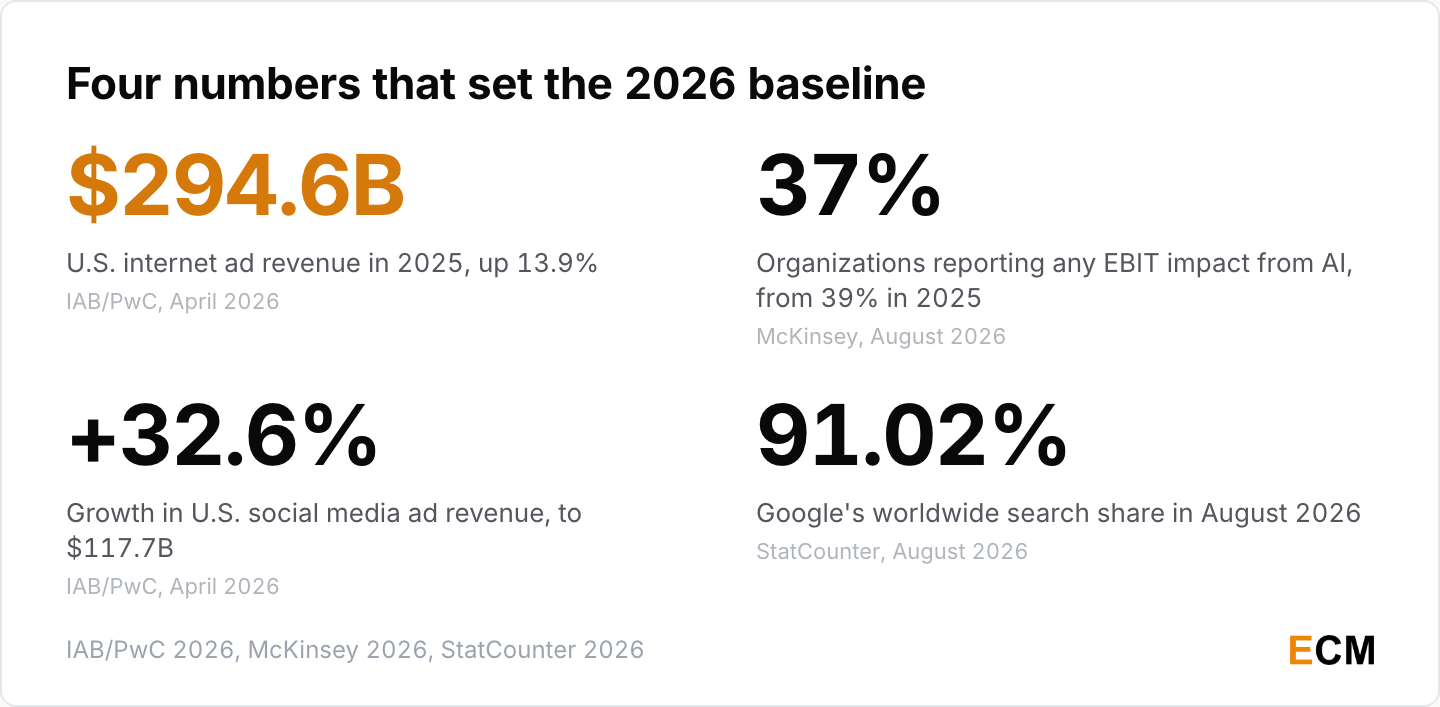
- U.S. digital ad spend set a record without a cyclical tailwind. $294.6 billion in 2025, up 13.9%, in a year with no election, Olympics or World Cup to carry it (IAB/PwC, April 2026).
- Social overtook search in the U.S. Social media ad revenue reached $117.7 billion against search’s $114.2 billion, growing 32.6% while search grew 11% (IAB/PwC, April 2026).
- AI adoption is near universal, AI profit is not. Nearly nine in ten organizations use AI somewhere, but the share reporting any EBIT impact went from 39% in November 2025 to 37% in August 2026, and high performers held at about 6% (McKinsey, “The State of AI in 2026”, August 2026).
- Google did not collapse. Its worldwide search share hit a 2025 low of 89.54% in mid-year and was back to 91.02% by August 2026 (StatCounter).
- The $42 email ROI number is really £42, from 2019 UK data. Litmus reports a 10:1 to 36:1 range, and 21% of marketers can’t calculate their ROI at all (Litmus 2025 State of Email, July 2025).
- Third-party cookies are still here. Google reversed the Chrome phase-out in July 2024 and confirmed in April 2025 that cookies stay enabled by default (Privacy Sandbox).
Digital Marketing Industry Size and Ad Spend Statistics
The headline totals for ad spend disagree with each other, and it isn’t because someone made a mistake. Each forecaster draws a different boundary.
How Big Is the Digital Marketing Industry in 2026?
Every global forecast lands near a trillion dollars, and U.S. digital ad spend is on track for double-digit growth again in 2026.
- Global ad revenue excluding U.S. political advertising reached $1.14 trillion in 2025, up 8.8% (WPP Media, “This Year Next Year”, December 2025).
- Dentsu trimmed its 2026 global ad spend growth forecast from 5.1% in December 2025 to 5.0% in May 2026, with spend reaching $1.06 trillion across 56 markets after passing $1 trillion in 2025, a year earlier than it had predicted (Dentsu midyear forecast, May 2026; December 2025 forecast).
- On a media-owner net basis, global ad revenue reached $979 billion in 2025, up 4.9%, a downgrade of 1.2 points from the December 2024 projection (MAGNA Global Ad Forecast, June 2025 update, 68 markets).
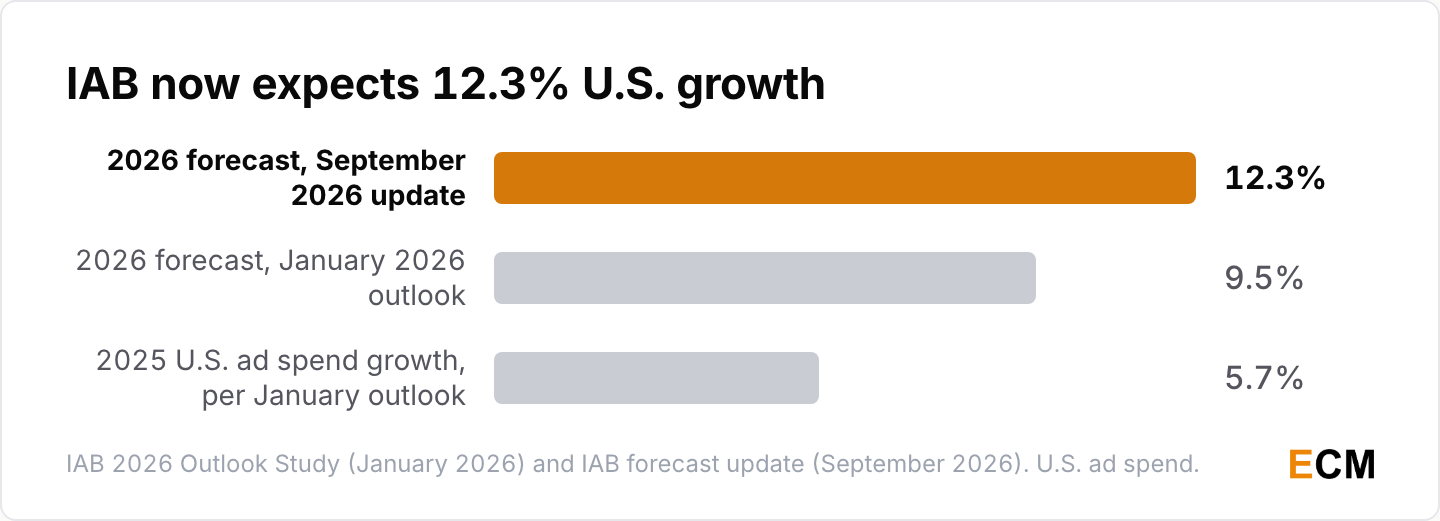
- IAB’s January outlook projected 9.5% U.S. ad spend growth for 2026 against 5.7% in 2025, on an ex-cyclical baseline of 7.1% to 7.8% (IAB 2026 Outlook Study, January 2026, more than 200 buyers). In September it raised the call to 12.3%, a 2.8-point upgrade after a first half carried by the Winter Olympics and the World Cup (IAB, September 2026).
IAB’s $294.6 billion is U.S. only, WPP’s $1.14 trillion is global without political, and MAGNA’s $979 billion is net. Quote any two side by side without their scope and they look like a contradiction.
Social Media Passed Search in U.S. Digital Ad Revenue
Social passing search in the U.S. is the structural headline of 2025. If your marketing channel mix still treats paid search as the default first dollar, the market moved.
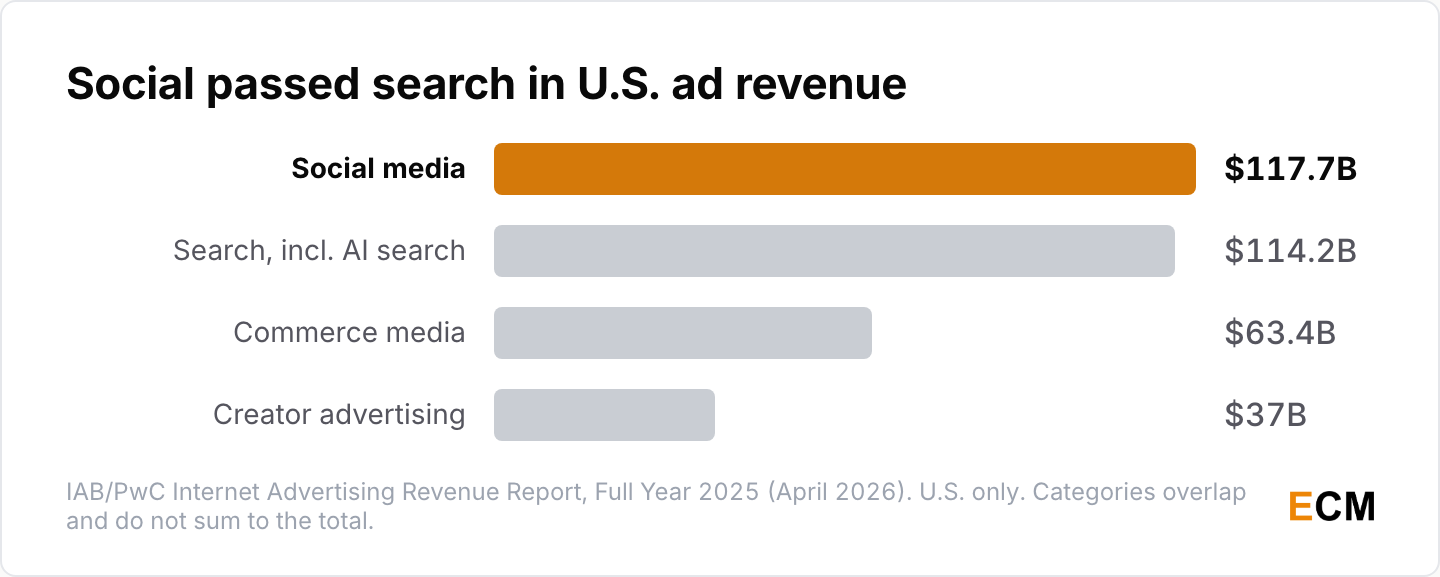
- Social media ad revenue reached $117.7 billion in 2025, growing 32.6%, the fastest-growing major channel in the census (IAB/PwC Full Year 2025, April 2026).
- Search advertising, including AI search, reached $114.2 billion, growing 11%, a real slowdown from 15.9% growth in 2024 (IAB/PwC Full Year 2025, April 2026).
- Commerce media, mostly retail media networks, grew 18.0% to $63.4 billion, and creator advertising reached $37 billion with $44 billion projected for 2026 (IAB/PwC Full Year 2025, April 2026).
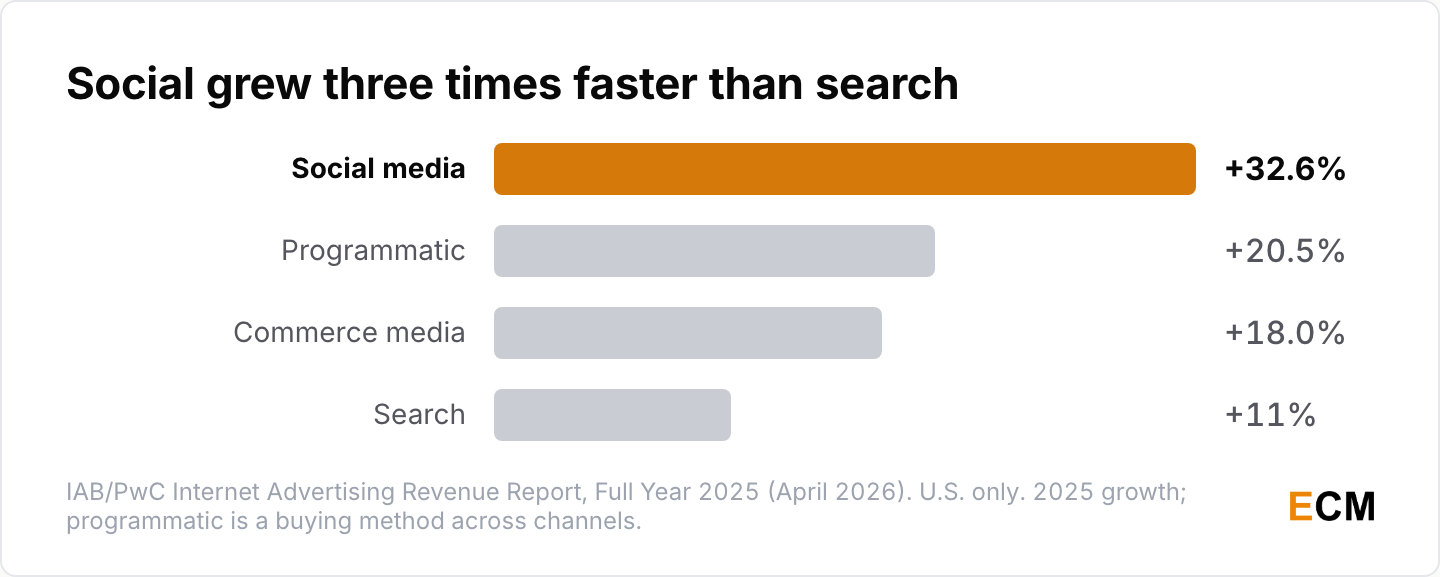
- Programmatic rose 20.5% to $162.4 billion in 2025 (IAB/PwC Full Year 2025, April 2026). Programmatic is a buying method that cuts across the channels above, so don’t add it to them.
What the Big Ad Platforms Reported for FY2025
SEC filings are the cleanest platform numbers available, because they’re audited and the definitions are disclosed. The catch is that each company reports a different line.
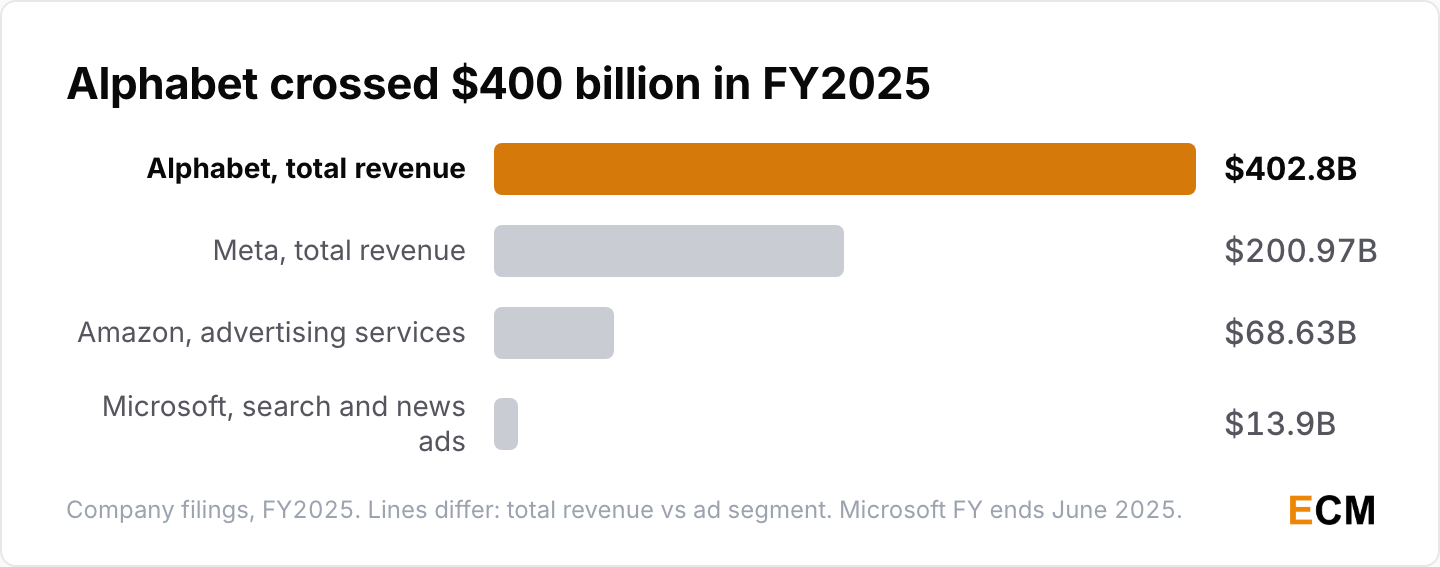
- Alphabet’s FY2025 revenue reached $402.8 billion, up 15%, its first year above $400 billion, and Google Search and other advertising delivered $63.07 billion in Q4 2025 alone, up 17% from $54.03 billion (Alphabet Q4 2025 earnings release, February 2026).
- YouTube revenue across ads and subscriptions exceeded $60 billion for full-year 2025, so don’t quote it as YouTube ad revenue (Alphabet Q4 2025 earnings release, February 2026).
- Meta’s FY2025 revenue was $200.97 billion, up 22%, and Meta says it generates substantially all of it from advertising (Meta FY2025 10-K, January 2026).
- Amazon’s advertising services revenue totaled $68.63 billion in FY2025, the sum of four disclosed quarters: $13.92B, $15.69B, $17.70B and $21.32B, with Q4 up 23% (22% excluding currency) (Amazon Q4 2025 8-K exhibit, February 2026).
- Microsoft’s search and news advertising revenue was $13.9 billion in the fiscal year ended June 30, 2025, up 13% from $12.3 billion; excluding traffic acquisition costs the same line grew 20%, with no dollar figure attached (Microsoft FY2025 10-K, July 2025).
How Concentrated the Ad Market Is
I’d cite MAGNA in any duopoly-versus-triopoly argument, because it names its denominator.
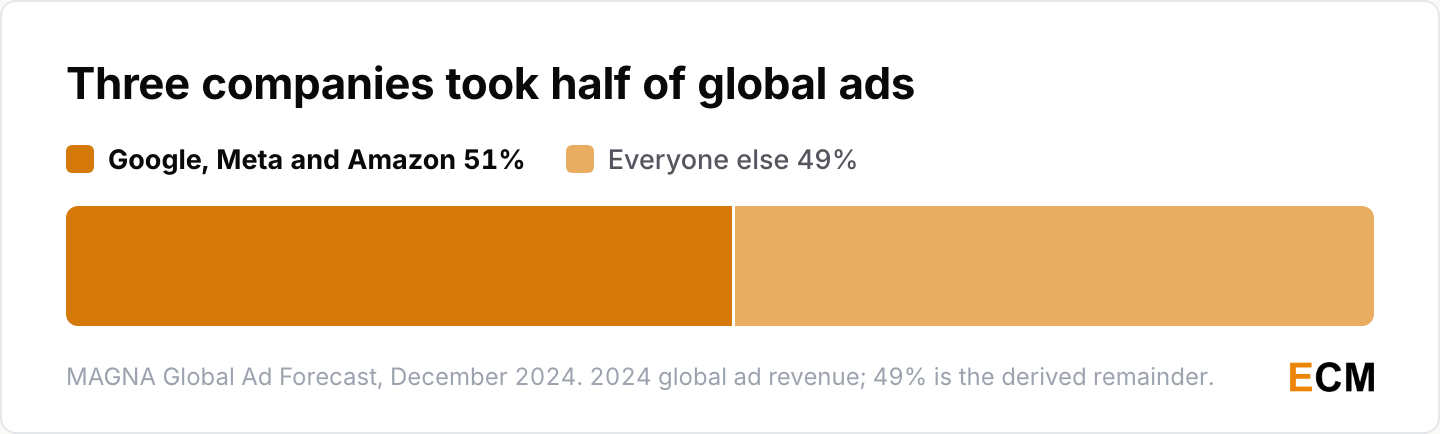
- Google, Meta and Amazon together took 51% of global ad revenue in 2024, leaving 49% for every other media owner, or 61% excluding China (MAGNA Global Ad Forecast, December 2024 edition).
Figures between 50% and 70%+ circulate for the same claim. The spread is almost entirely down to whether the base is global or U.S., gross or net, and whether China is in it.
SEO and Search Engine Marketing Statistics
Search is still the largest single ad format on earth, and SEO still lives on it. What’s changing is the surface results get served on.
Google Search Market Share in 2026
Google’s share dipped below 90% for most of 2025 and took about a year to come back.
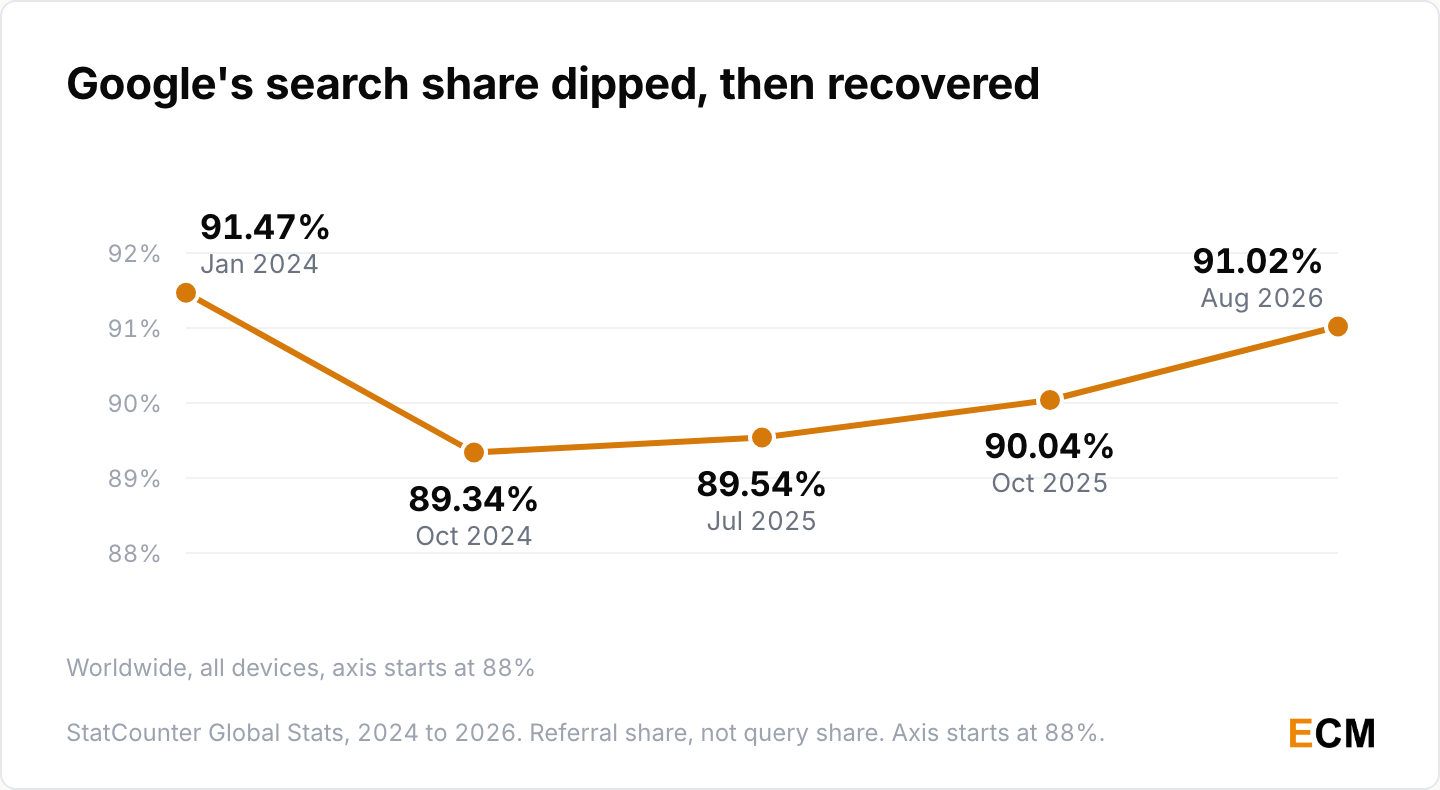
- Google held 91.47% of worldwide all-devices search referrals in January 2024, fell to 89.34% in October 2024, and hit its 2025 low of 89.54% in June and July after 89.71% in March (StatCounter Global Stats).
- It recovered to 90.04% in October 2025, climbed back above 91% in June 2026 and stood at 91.02% in August 2026 (StatCounter Global Stats).
- Bing held 4.01% worldwide in March 2025, and 12.21% on desktop alone, where Windows defaults help it (StatCounter Global Stats, March 2025).
StatCounter measures referrals to sites carrying its tracking code, not queries. If a search engine answers more questions on its own results page, its measured share can fall while its query share holds. Our SEO statistics page goes deeper on the click-side effects.
How AI Overviews Are Changing Search
AI Overviews grew by a billion monthly users in about 14 months, while search advertising kept its crown.
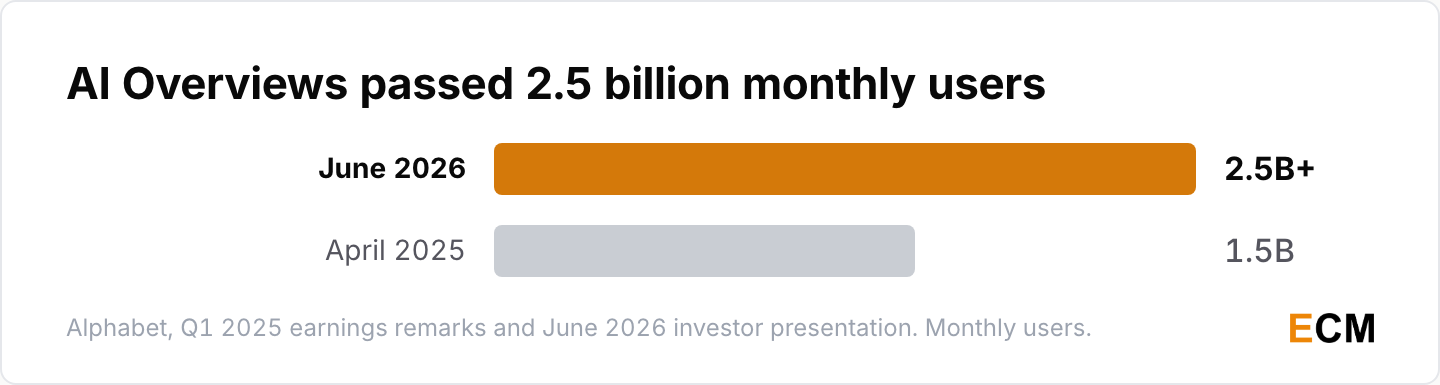
- AI Overviews passed 1.5 billion users a month in April 2025 (Sundar Pichai, Alphabet Q1 2025 earnings remarks) and more than 2.5 billion by June 2026 (Alphabet investor presentation, June 2026).
- Keyword search remained the largest advertising format globally at $330 billion in 2024, equal to 35% of all ad spend and 50% of digital (MAGNA Search Report, 2025).
Alphabet has never disclosed the AI Overviews monetization rate or its click-through impact on publisher traffic. When you see “AI Overviews cut clicks by X%,” name the firm that estimated it. You can check whether a query triggers one with our AI Overview checker.
AI Marketing Statistics for 2026
This is the section I’d read first if I were writing a 2026 marketing budget. AI is the marketing trend with the widest gap: adoption is close to universal and measurable profit is rare.
How Many Organizations Use AI in 2026?
AI use is close to universal now, and the growth has moved to scaling it.
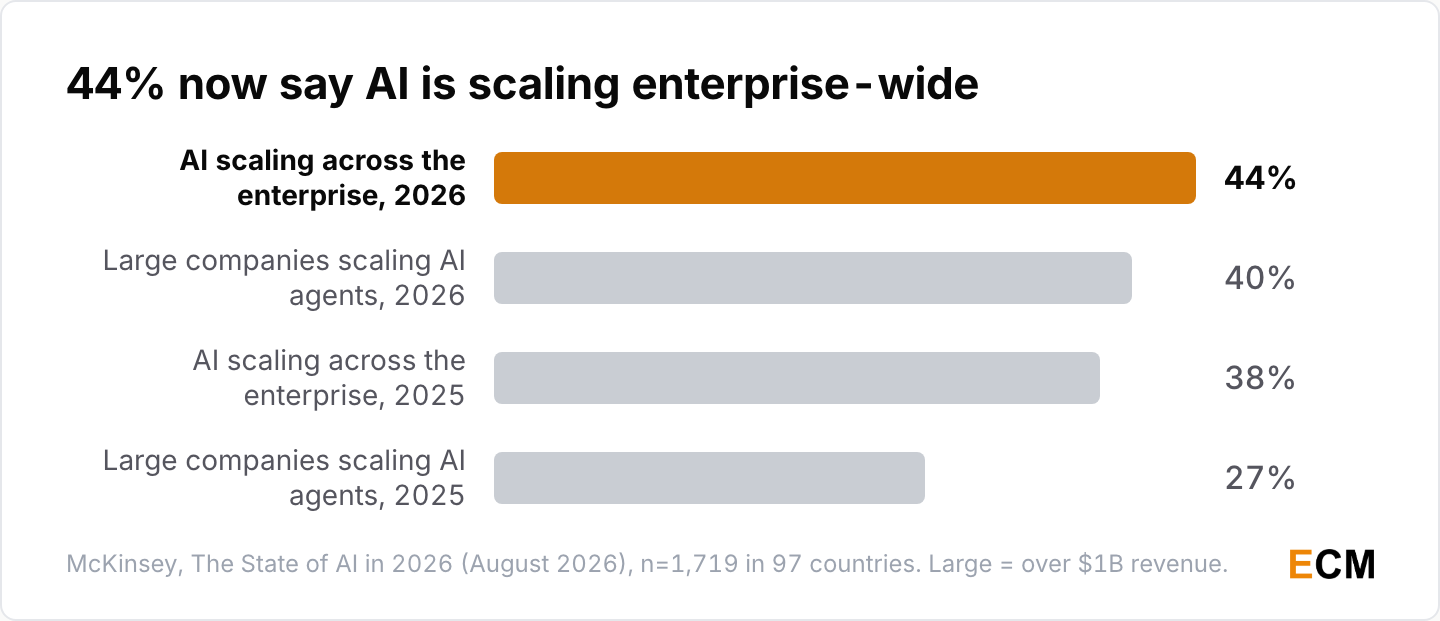
- Nearly nine in ten respondents report regular AI use in at least one business function, after 88% in the November 2025 edition, and 44% say AI is now scaling across their enterprise, up from 38% a year earlier (McKinsey, “The State of AI in 2026”, August 2026, n=1,719 across 97 countries; McKinsey 2025 edition, n=1,993).
- 40% of respondents at companies with more than $1 billion in revenue report scaling AI agents, up from 27% a year earlier, while smaller organizations held at 22% (McKinsey, August 2026). In November 2025, 62% were at least experimenting with agents and 23% were scaling them somewhere (McKinsey 2025 edition).
What Is the Success Rate of AI in Marketing?
Success, measured as profit, is the gap. Use kept rising between McKinsey’s last two surveys, and the share seeing it on the bottom line did not.
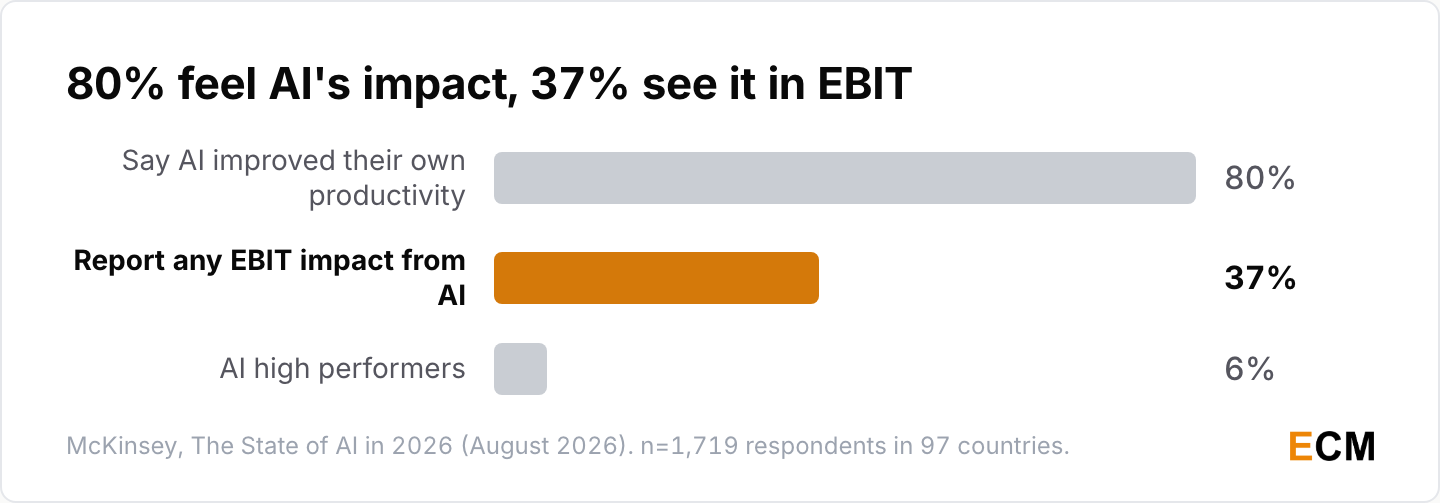
- 37% of respondents attribute at least some EBIT impact to AI, against 39% in November 2025, which McKinsey reads as essentially unchanged, even though 80% say AI improved their own productivity (McKinsey, “The State of AI in 2026”, August 2026; McKinsey 2025 edition, November 2025).
- About 6% qualify as AI high performers, reporting significant value and at least 5% EBIT impact, unchanged from 2025 (McKinsey, August 2026). In the 2025 edition they were more than 3x as likely as peers to aim AI at transformative change (McKinsey 2025 edition).
The high performers got there by rewiring workflows rather than bolting tools onto existing ones. I read that as the whole finding: the tool was never the variable.
How Marketers Plan to Use AI
Marketers’ intent is ahead of the profit data, and the money is following chatbots and agents as marketing tools for content and campaigns.
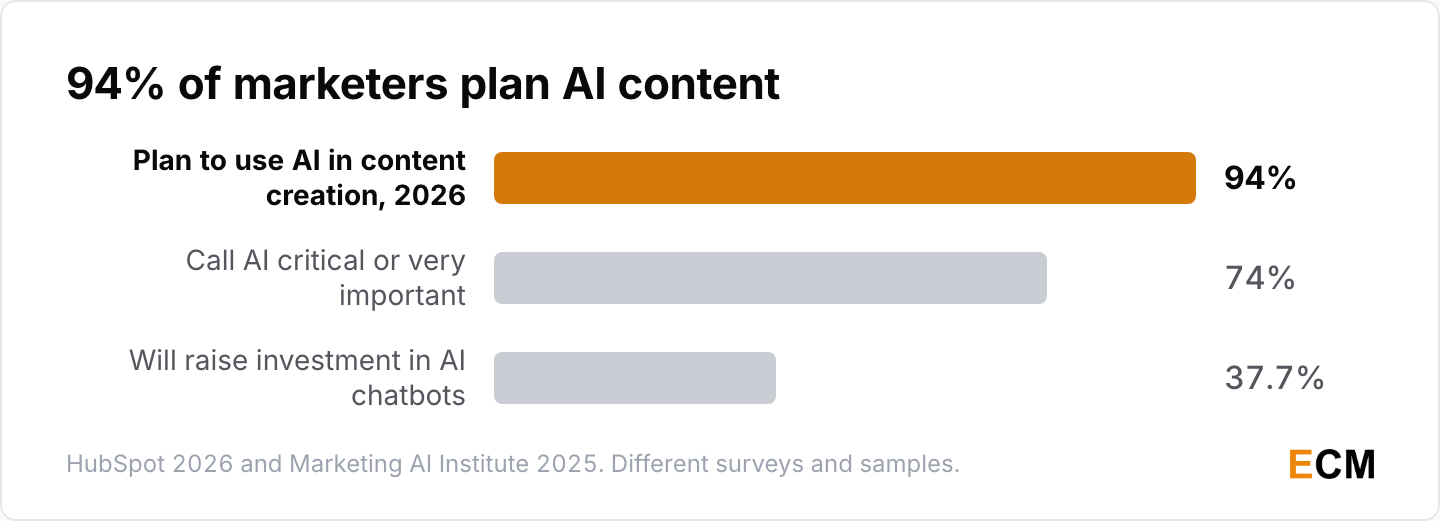
- About 94% of marketers plan to use AI in their content creation processes in 2026 (HubSpot State of Marketing 2026).
- 74% of marketers call AI critically or very important to their marketing in the next year, from a sample that skews AI-fluent (Marketing AI Institute / SmarterX 2025 State of Marketing AI Report, May 2025, about 1,900 respondents).
- Five of the top six buyer focus areas for 2026 are AI-driven, and two-thirds of buyers are focused on agentic AI for ad buying and campaign execution (IAB 2026 Outlook Study press release, January 2026).
- AI chatbots such as ChatGPT, Perplexity, Gemini and Claude top the list of areas marketers will increase investment in for 2026, at 37.7%, just ahead of paid social at 37.4% (HubSpot 2026 State of Marketing Report).
HubSpot, Litmus, Sprout Social, AppsFlyer and the Marketing AI Institute all sell software or training in the categories they survey. Their data is good for direction and bad for precision. For how AI is landing in editorial teams, see our content marketing statistics.
Is There High Demand for Digital Marketers?
Yes. The federal projections still show marketing roles growing faster than the average job, even as marketers themselves worry about AI.
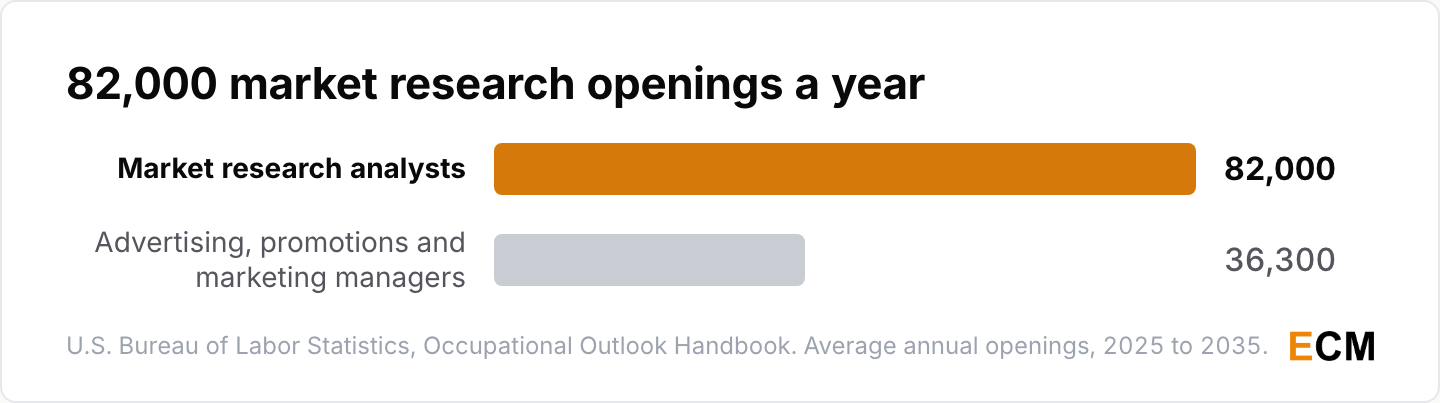
- Employment of market research analysts is projected to grow 7% from 2025 to 2035, with about 82,000 openings a year (U.S. Bureau of Labor Statistics, Occupational Outlook Handbook).
- Employment of advertising, promotions and marketing managers is projected to grow 6% over the same decade, with about 36,300 openings a year, and marketing managers earned a median $166,790 in May 2025 (U.S. Bureau of Labor Statistics, Occupational Outlook Handbook).
- 53% of marketers believe AI will eliminate more marketing jobs than it creates, and 62% name lack of training as a top barrier to adoption (Marketing AI Institute / SmarterX 2025 State of Marketing AI Report, May 2025).
Social Media Marketing Statistics for 2026
Pew is the cleanest U.S. social usage source available, because it’s a probability-based national survey rather than a vendor panel.
Which Social Platforms U.S. Adults Use
YouTube and Facebook still reach most Americans, and Reddit is the one climbing.
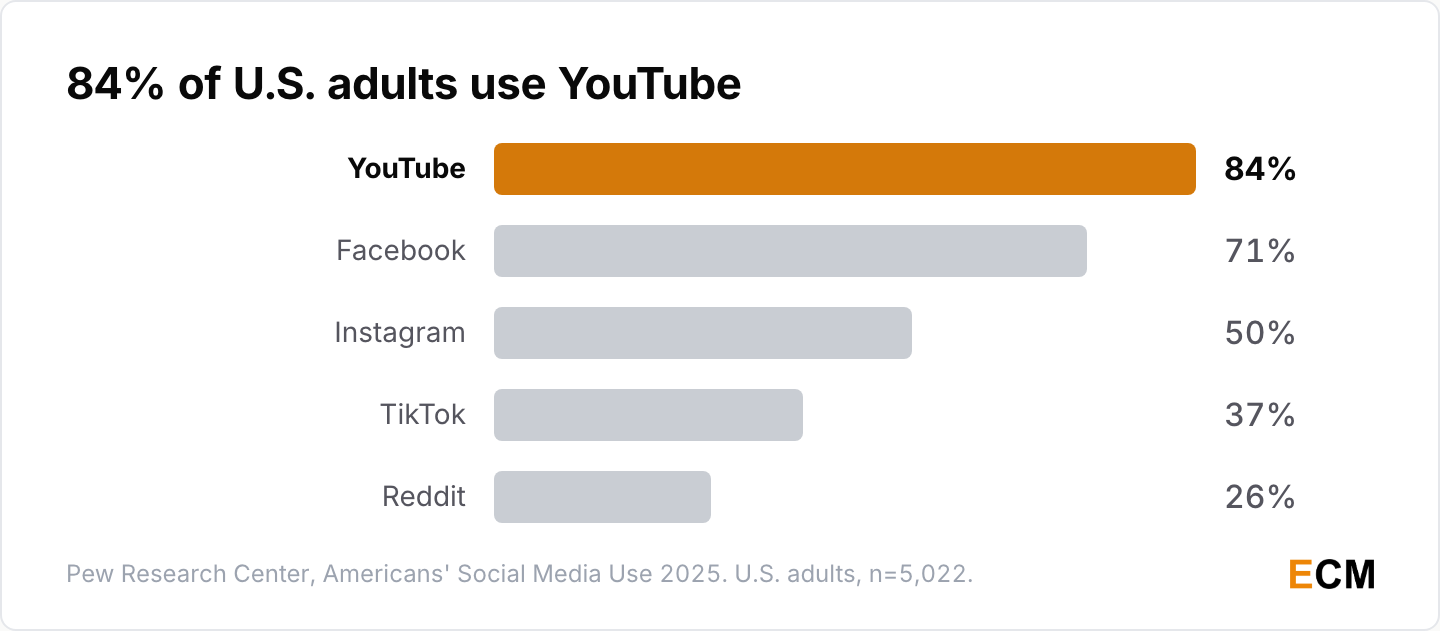
- 84% of U.S. adults use YouTube and 71% use Facebook (Pew Research Center, “Americans’ Social Media Use 2025”, November 2025, n=5,022, fielded February to June 2025).
- Half of U.S. adults use Instagram, the only other platform at least half of Americans use, and 37% use TikTok (Pew Research Center, November 2025).
- 26% of U.S. adults use Reddit, up from 18% four years earlier, in a survey with a 29% response rate (Pew Research Center, November 2025).
Social Media Demographics That Change Targeting
Instagram’s audience splits sharply by race and gender, which matters more than the headline 50%.
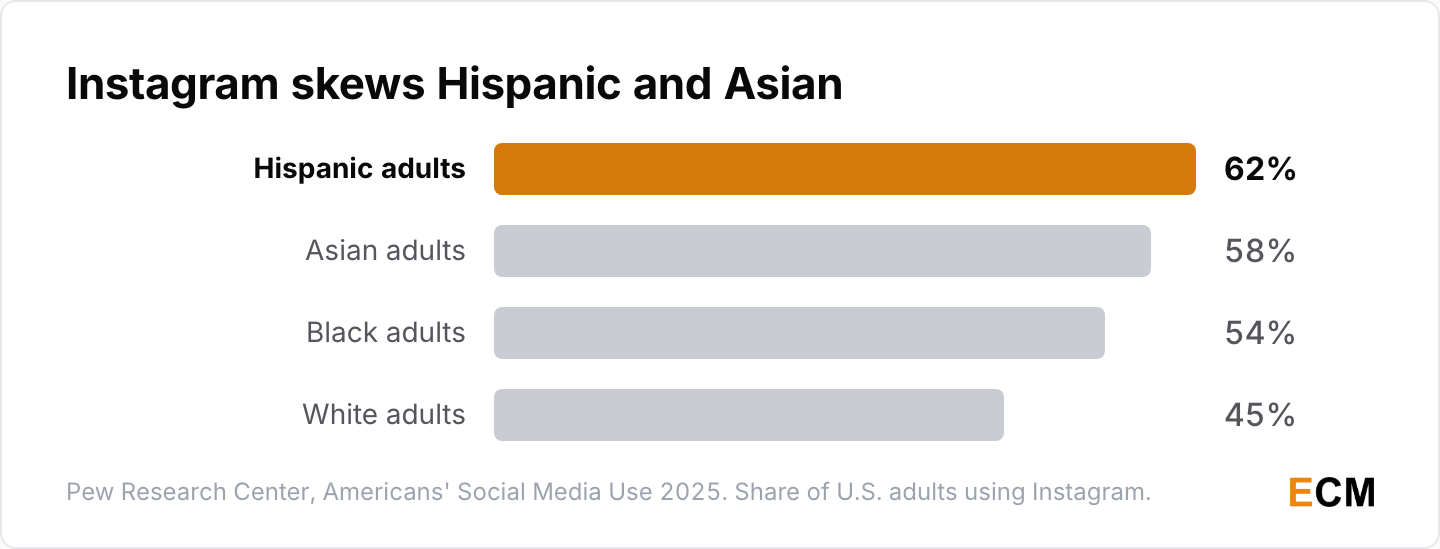
- Instagram use runs 62% among Hispanic adults, 58% among Asian adults, 54% among Black adults and 45% among White adults (Pew Research Center, November 2025).
- 55% of women use Instagram against 44% of men, while men are more likely to use X and Reddit (Pew Research Center, November 2025).
Content-Driven Ads and Social Customer Care
Social and digital platforms now take most content-driven ad money, and social has become a customer service channel people judge brands on.
- Social and digital platforms took $413.0 billion of the $663.5 billion spent on content-driven advertising worldwide in 2025, more than half, growing 12.8%; commerce media reached $178.2 billion and passed total TV ad revenue for the first time (WPP Media, “This Year Next Year”, December 2025).
- 73% of consumers will choose a competitor if their questions on social go unanswered, and 94% of social practitioners feel they have to be chronically online to do their job (Sprout Social Index 2025, fielded September 2024).
For the format-level picture behind the creator numbers, our video marketing statistics break out platform performance.
Email Marketing Statistics and ROI Benchmarks
Email marketing is still the channel with the best-known ROI claim, and that claim needs its date attached.
What Is the ROI of Email Marketing?
The famous 42-to-1 is a 2019 UK number. Current research gives a range, and a fifth of marketers can’t place themselves in it.
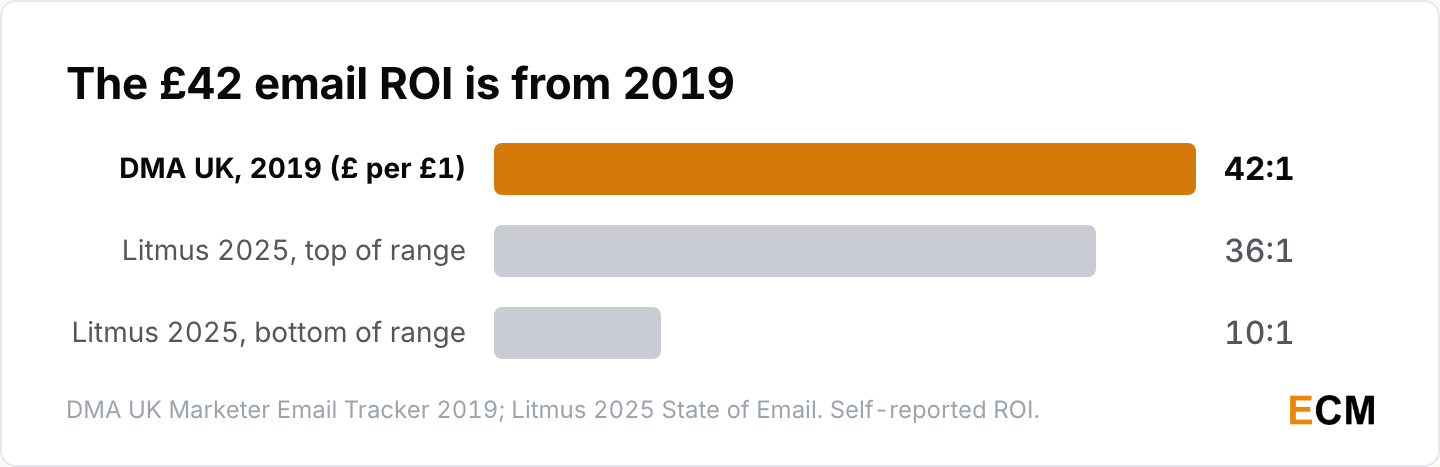
- The widely quoted £42 returned per £1 spent comes from the DMA UK Marketer Email Tracker 2019: UK-only, self-reported, and published before iOS Mail Privacy Protection and Gmail’s one-click unsubscribe.
- Marketers reported email ROI between 10:1 and 36:1 in Litmus’s current research, and 21% admitted they don’t know their email ROI at all (Litmus 2025 State of Email, July 2025, nearly 500 respondents across the US, UK, Canada, Australia and Ireland).
- Advanced AI adopters are 75% more likely to report email ROI above 45:1 (Litmus 2026 State of Email).
I’d rather quote a range with a known method than a single number with none. The 21% is the more useful stat, because it says the median email program has no attribution worth arguing about.
Email Open Rate and Unsubscribe Benchmarks
Both headline email metrics moved in 2025 for measurement reasons, not audience reasons.
- The median open rate across 3.6 million campaigns was 43.46% in 2025, up from 42.35% in 2024 (MailerLite Email Marketing Benchmarks, December 2025, 181,000 approved accounts).
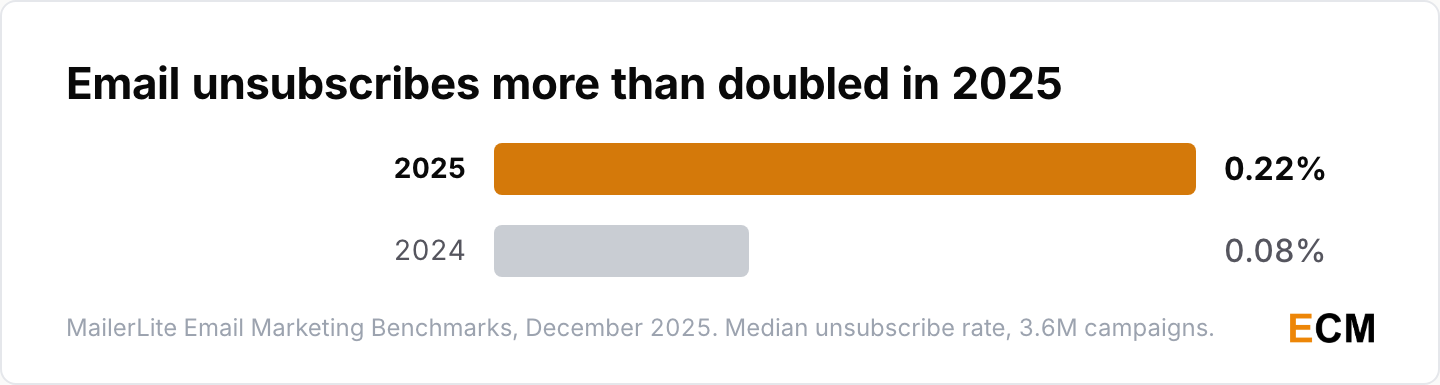
- The median unsubscribe rate more than doubled, from 0.08% in 2024 to 0.22% in 2025, which MailerLite attributes largely to Gmail’s one-click unsubscribe (MailerLite Email Marketing Benchmarks, December 2025).
Apple Mail Privacy Protection fires opens the recipient never made, so treat that open rate as inflated. Our email marketing statistics page compares platform benchmarks side by side.
How AI Changed Email Production
AI turned email production from a two-week job into a three-day one.
- Use of generative AI to create images for email rose 340% between 2024 and 2025 (Litmus 2025 State of Email, July 2025).
- In 2024, 62% of teams took two weeks or more to produce an email; by 2026, 78% ship in three days or less (Litmus 2026 State of Email).
- Advanced AI adopters are 54% more likely to follow WCAG accessibility standards and 52% more likely to comply with the European Accessibility Act (Litmus 2026 State of Email).
Privacy, Attribution and Marketing Budget Statistics
Measurement got harder and budgets got bigger at the same time, which is why every line item now gets questioned.
Third-Party Cookie Statistics
Google kept cookies, then retired most of Privacy Sandbox in October 2025, so the test results below are history rather than a live fix.
- Google announced in July 2024 that it would not proceed with the third-party cookie phase-out in Chrome, and confirmed in April 2025 it would not add a separate consent prompt either (Privacy Sandbox; Privacy Sandbox, April 2025).
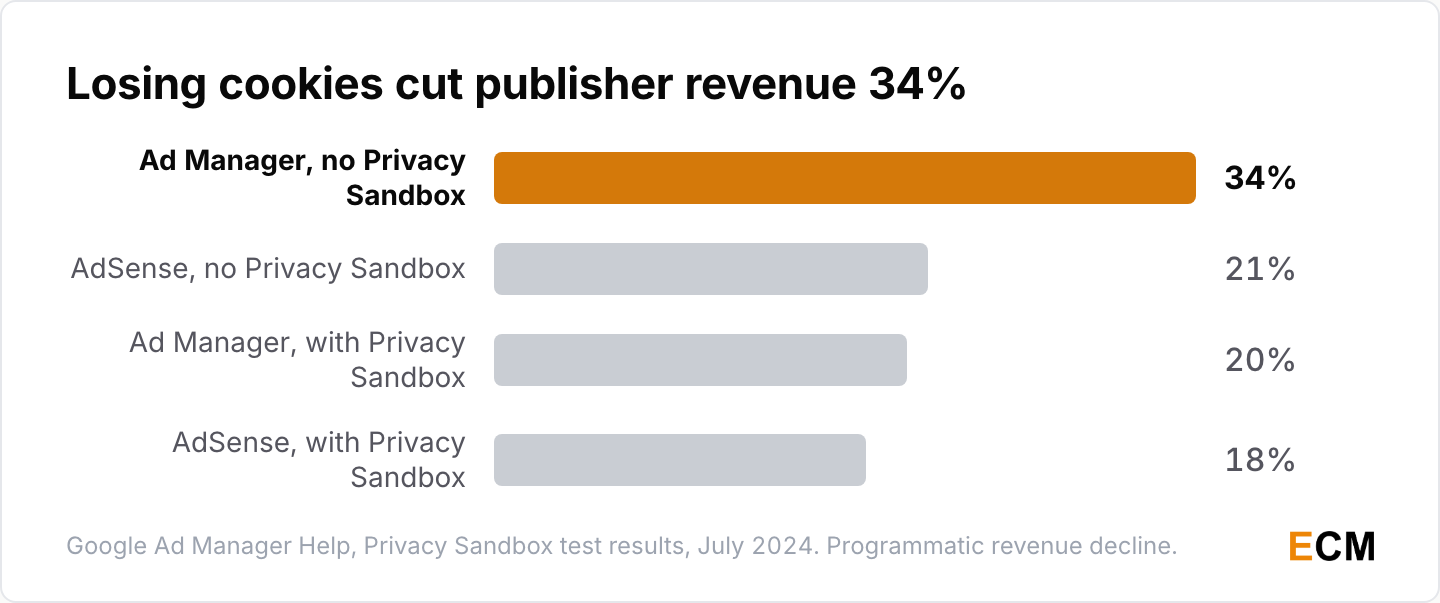
- Google’s July 2024 tests found removing third-party cookies cut programmatic revenue 34% for Google Ad Manager publishers and 21% for AdSense publishers, moderating to 20% and 18% with Privacy Sandbox running (Google Ad Manager Help, “Results from Privacy Sandbox APIs testing”, July 2024, archived copy).
- Measured per impression, the UK regulator puts the falls at 27% on Ad Manager traffic and 15% on AdSense, with Privacy Sandbox mitigating them by 13 and 3 percentage points (CMA, “Testing of Google’s Privacy Sandbox proposals”, 13 June 2025).
- Independent testers saw publisher revenue fall between about 20% and 50%, with the median tester at 30% (CMA, June 2025).
- The ad tech firms’ own numbers run higher: Criteo projected an average 60% publisher revenue loss from Chrome (Criteo, 2024) and Index Exchange saw a 33% CPM decline on Sandbox-enabled impressions (Index Exchange, July 2024).
- Google then retired most Privacy Sandbox APIs in October 2025, citing low adoption, keeping CHIPS, FedCM and Private State Tokens (Privacy Sandbox, 17 October 2025).
Mobile Attribution and ATT Statistics
Apple’s tracking prompt did not kill iOS advertising. Spend grew faster on iOS than on Android, and half of users now opt in.
- Roughly 50% of global iOS users now opt in to App Tracking Transparency, a 10-point increase since ATT launched in April 2021 (AppsFlyer, April 2025).
- iOS ad spend grew 26% from 2023 to 2024 against 10% for Android, and developer ATT adoption rose 4% in 2024 to sit 71% higher than in 2021 (AppsFlyer, April 2025).
Marketing Budget Statistics for 2026
Budgets say digital marketing is still worth it. Most teams expect more money in 2026, and they also expect to defend it harder.
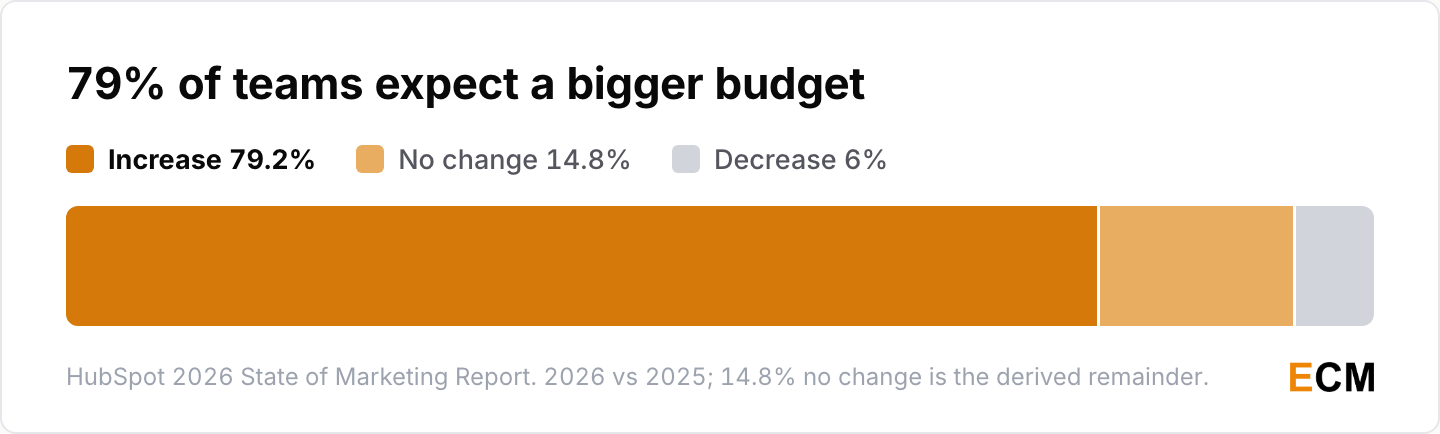
- 79.2% of marketing teams expect at least a slight budget increase in 2026, 21.2% expect a significant increase and 6% expect a decrease, leaving 14.8% expecting no change (HubSpot 2026 State of Marketing Report).
- 73% of marketers say their budget gets more scrutiny now than in the past (HubSpot 2026 State of Marketing Report).
- 90% of CMOs saw revenue growth over the past 12 months (dentsu, January 2026), and 42% plan to invest more in producing or sponsoring original content (dentsu, December 2025), both from its CMO Navigator survey of 1,950+ marketing leaders in 14 countries (dentsu CMO Navigator, January 2026).
- 9 in 10 buyers are concerned about the impact of tariffs on ad spend, and IAB puts the chance of a recession disrupting its forecast at roughly 1 in 3 (IAB 2026 Outlook Study, January 2026).
A market that grew 13.9% while few could prove the AI spend paid off is the normal setup for more scrutiny. If you need to defend a line item this year, the McKinsey EBIT number is the one your CFO already knows.
Frequently Asked Questions
What are the key digital marketing statistics for 2026?
U.S. internet ad revenue reached $294.6 billion in 2025, up 13.9% (IAB/PwC, April 2026). Social passed search at $117.7 billion. Nearly nine in ten organizations use AI but only 37% report EBIT impact (McKinsey, August 2026). Google held 91.02% of worldwide search (StatCounter, August 2026).
How big is the digital marketing industry and what is its growth rate?
Global ad revenue reached $1.14 trillion in 2025, up 8.8% (WPP Media, December 2025), and Dentsu expects 5.0% growth in 2026, trimmed from 5.1% (Dentsu, May 2026). The U.S. digital market alone was $294.6 billion, and IAB now forecasts 12.3% U.S. growth for 2026 (IAB, September 2026).
Is digital marketing still worth it in 2026?
The spending says yes. 79.2% of marketing teams expect a bigger budget in 2026 (HubSpot) and 90% of CMOs saw revenue growth over the past year (dentsu, January 2026). The catch is proof: 73% say their budget faces more scrutiny than before.
Is the $42 email ROI statistic still accurate?
Not as a current figure, and it was never a dollar figure. It is £42 per £1, from the DMA UK’s 2019 Marketer Email Tracker. Litmus’s research reports 10:1 to 36:1, with 21% of marketers unable to calculate ROI at all (Litmus, July 2025). Use the range and name the method.
How is AI changing digital marketing in 2026?
Nearly nine in ten organizations use AI in at least one function, and 40% of large companies are scaling AI agents, up from 27% a year earlier (McKinsey, August 2026). In email, 78% of teams now ship in three days or less (Litmus 2026). AI chatbots top marketers’ 2026 investment list at 37.7% (HubSpot).
What share of digital ad spend goes to Google, Meta and Amazon?
MAGNA puts the three at 51% of global ad revenue in 2024, or 61% excluding China (MAGNA, December 2024). Reports citing 50% to over 70% differ on the denominator: global versus U.S., gross versus net, and whether China is in.
Is social media advertising bigger than search now?
In the U.S., yes, as of 2025: $117.7 billion for social against $114.2 billion for search, growing 32.6% and 11% (IAB/PwC, April 2026). Globally, keyword search is still the largest single ad format, per MAGNA’s Search Report.
What is happening to organic search traffic with AI Overviews?
Alphabet hasn’t disclosed the click-through impact. AI Overviews passed 2.5 billion monthly users by June 2026 (Alphabet), and Google Search revenue grew 17% in Q4 2025 (Alphabet Q4 2025), so search monetization is intact. Third-party click estimates contradict each other; cite them by firm.
Written by
Editorial Staff
The Editorial Staff represents the writers, editors, and content creators who have worked (or work) at Elite Content Marketer. The experimenter-in-chief behind the team is Chintan Zalani, who has close to a decade of experience trying to make sense of the content marketing industry. Started in 2019, Elite Content Marketer is on a mission to help creators build sustainable businesses.
Related Articles

Marketing Data
58 AI Personalization Statistics for 2026: ROI + Adoption
58 AI personalization statistics for 2026: 78% of marketers can’t make enough personalized content, and 87% of brands rate it good while 29% of consumers agree.
Oct 2, 2026Read more →
Marketing Data
60 AI Workflow Automation Statistics for 2026
60 AI workflow automation statistics for 2026: 37% of respondents see any EBIT impact from AI, 6% are high performers, and agents scale at big firms.
Oct 1, 2026Read more →
Marketing Data
AI Image Generation Statistics 2026: 60 Data Points
60 AI image generation statistics for 2026: people now create more than 3 billion images a week with ChatGPT Images and OpenAI’s API.
Sep 30, 2026Read more →