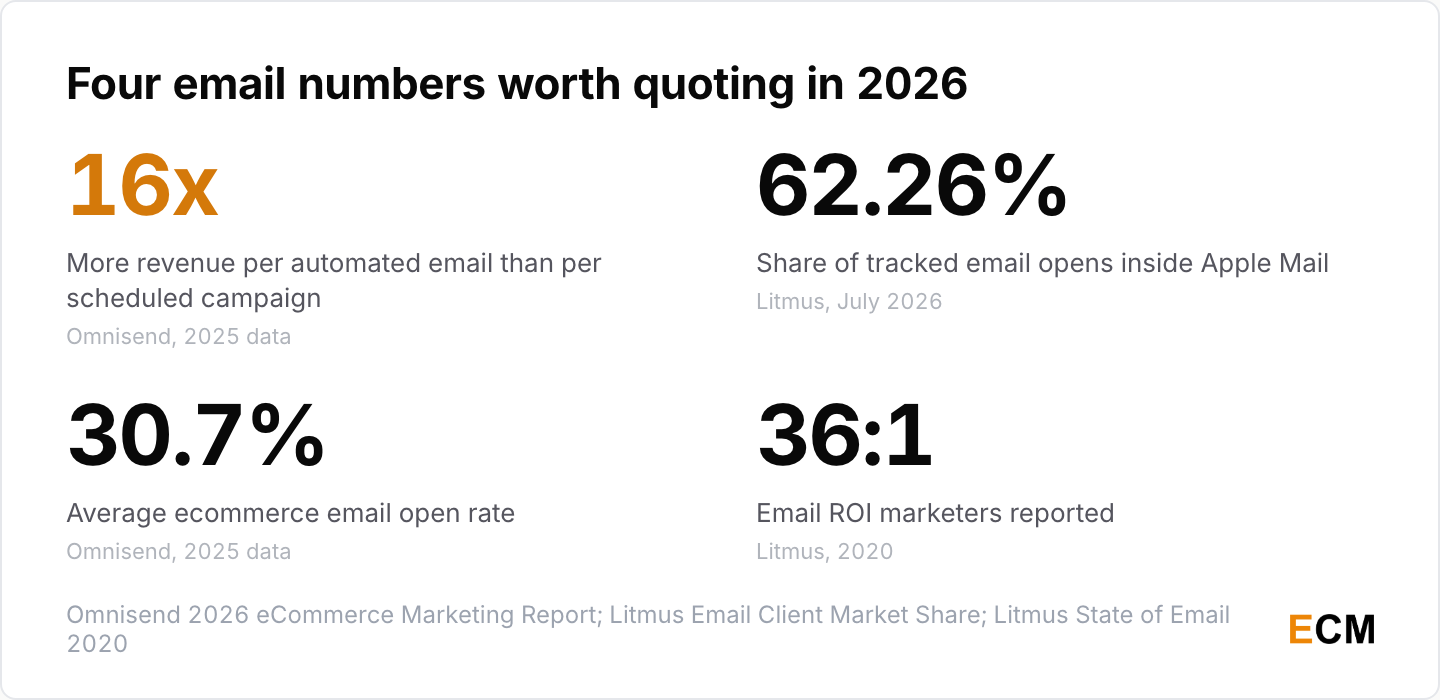
Automated emails earn 16 times more revenue per send than scheduled campaigns, $2.87 against $0.18 (Omnisend 2026 eCommerce Marketing Report, 2026). That gap is the clearest signal in this year’s email marketing stats. Open rates, meanwhile, measure Apple’s servers as much as your readers.
59 Email Marketing Stats for 2026: Open Rates and ROI
 Written by Editorial Staff
Key Takeaways
- Automation carries the channel. Automated emails were 2% of Omnisend sends and 30% of email revenue in 2025 (Omnisend, 2026).
- There is no single average open rate. Platforms publish averages from 30.7% for ecommerce (Omnisend, 2025 data) to 39.64% (GetResponse, 2023 data), because each counts opens differently.
- Apple decides what an open means. Apple Mail took 62.26% of tracked opens in July 2026 (Litmus Email Client Market Share, 2026).
- The famous ROI figure has a date. UK marketers reported £42.24 back for every £1 spent in 2018 (DMA Marketer Email Tracker, 2019), and Litmus put the global figure at 36:1 in 2020 (Litmus State of Email, 2020).
- Build times collapsed. 6% of email teams needed more than two weeks to build an email in 2025, against 62% in 2024 (Litmus and Validity, 2025).
- Authentication is mandatory. Gmail and Microsoft both require SPF, DKIM and DMARC from anyone sending 5,000 or more messages a day to their consumer inboxes (Google, 2024; Microsoft, 2025).
Top Email Marketing Stats for 2026: ROI and Value
Email is the oldest digital marketing channel in most plans and still earns its place. These are the latest email marketing statistics on what it returns, most from surveys run 2018 to 2020.
Is Email Marketing Still Worth It in 2026
Yes. Email marketing platforms keep growing, send volume keeps climbing, and in 2020 marketers ranked email above social when forced to choose.
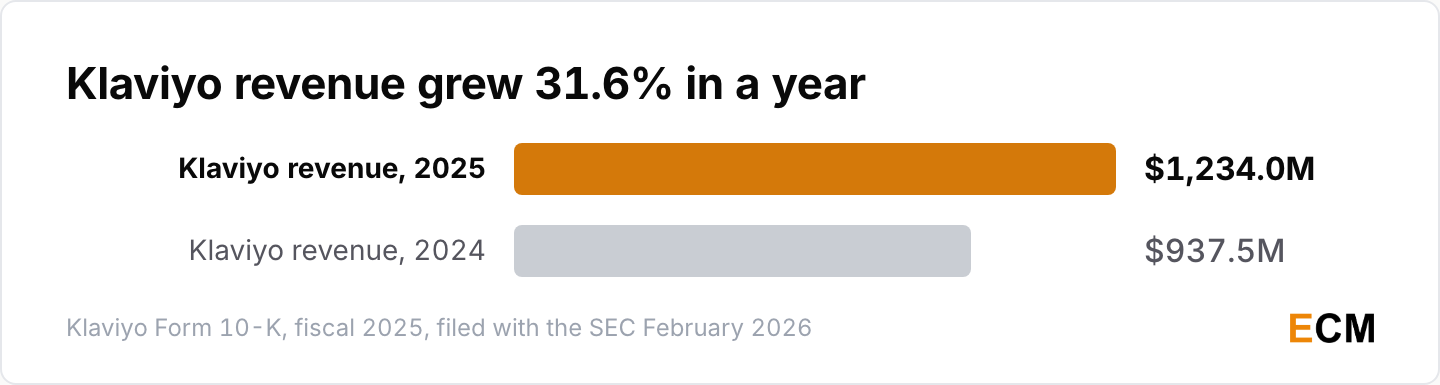
- Klaviyo grew revenue 31.6% in a year, from $937.5 million in 2024 to $1,234.0 million in 2025, and served over 193,000 customers at year end, up from 167,000 (Klaviyo Form 10-K, February 2026).
- 4 out of 5 marketers said they would rather give up social media than email marketing for a year (Litmus State of Email Report, Fall 2020).
- Volume keeps climbing: Omnisend merchants sent 27 billion emails across 150,000 brands in 2025 (Omnisend 2026 eCommerce Marketing Report, 2026), and beehiiv publishers sent 28 billion to more than 255 million unique readers (beehiiv State of Newsletters 2026, January 2026).
What Is the Average ROI for Email Marketing
Litmus measured $36 per $1 in 2020. The $42 line comes from a 2018 UK survey reported in pounds.
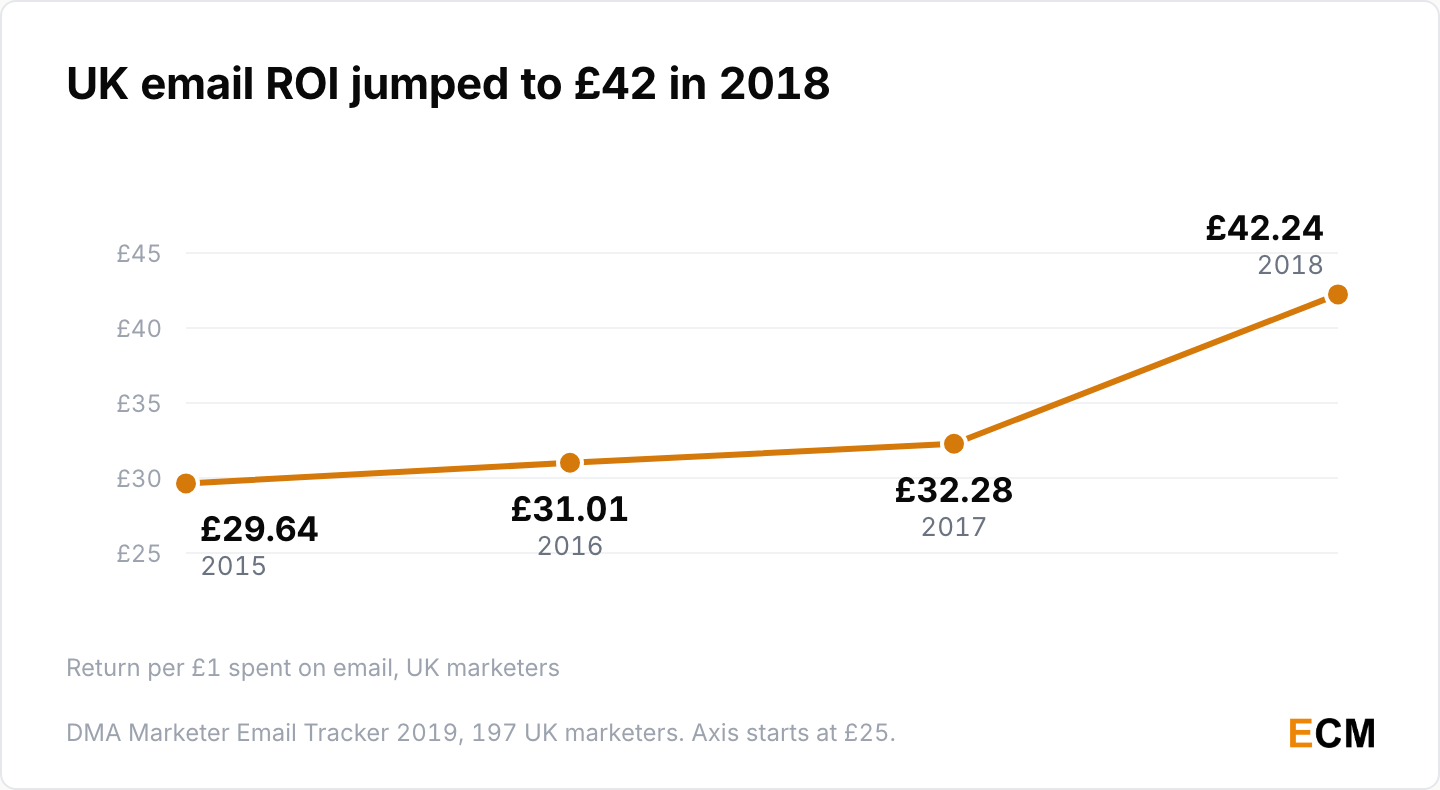
- UK email ROI stood at £42.24 for every £1 spent in 2018, up from £29.64 in 2015, £31.01 in 2016 and £32.28 in 2017 (DMA Marketer Email Tracker 2019, survey of 197 UK marketers, January 2019). This is the origin of the “$42 for every $1” line.
- Litmus recorded global email ROI falling from 42:1 in 2019 to 36:1 in 2020 (Litmus State of Email Report, Fall 2020, over 2,000 marketers).
- Litmus still cites $36 for every $1 spent as its headline email ROI figure (Litmus 2024 State of Email Trends, 2024). Quote it with its 2020 date.
Email ROI by Industry
In Litmus’s industry split, retail leads, which fits a channel that sells products well and relationships slowly.
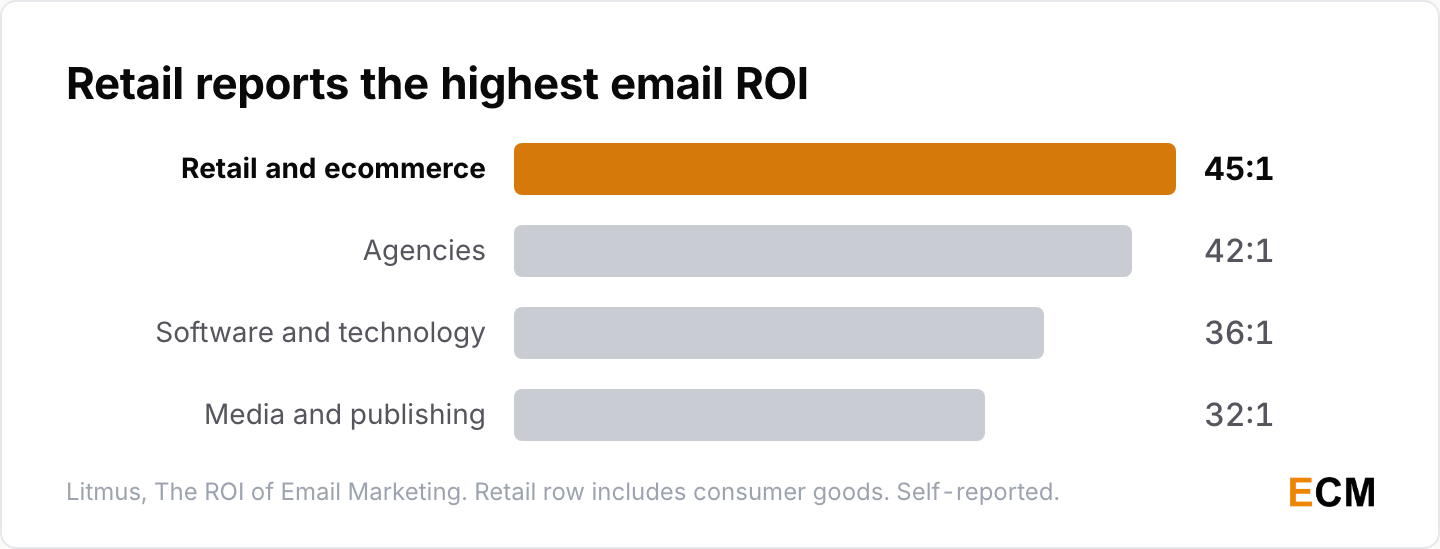
- Retail, ecommerce and consumer goods reported the highest email ROI at 45:1, ahead of agencies at 42:1, software and technology at 36:1 and media and publishing at 32:1 (Litmus, The ROI of Email Marketing, from its 2020 State of Email survey of more than 2,000 marketers).
- Marketers classed as advanced AI adopters are 75% more likely to report email ROI above 45:1 (Litmus State of Email 2026, 2026, 500 marketers in the US, UK, Australia and New Zealand).
What Are the KPIs for Email Marketing
Revenue per send and click-to-conversion beat opens as email marketing metrics. Proving email’s return is still hard for about one team in five.
- 61% of marketers did not have a clear view of their email ROI (Litmus 2021 State of Email, 2021).
- 22% of marketers say they struggle to measure or prove email ROI (Litmus and Validity, State of Email 2025, June 2025). It is a different question from a different panel, so I don’t read the two as a trend.
- Omnisend’s click-to-conversion rate rose 53% in a year, from 5.9% to 9.0%, even as click-to-open fell (Omnisend 2026 eCommerce Marketing Report, 2026). A smaller share of openers clicked, and the ones who clicked bought more often.
Email Open Rates and Email Marketing Benchmarks
Each platform below publishes benchmarks from its own send logs, so the numbers are not interchangeable. I keep each one attached to the platform that produced it.
What Are Typical Email Open and Click Rates
Expect a nine-point spread on open rates and a far tighter one on clicks, which is why clicks are the better yardstick.
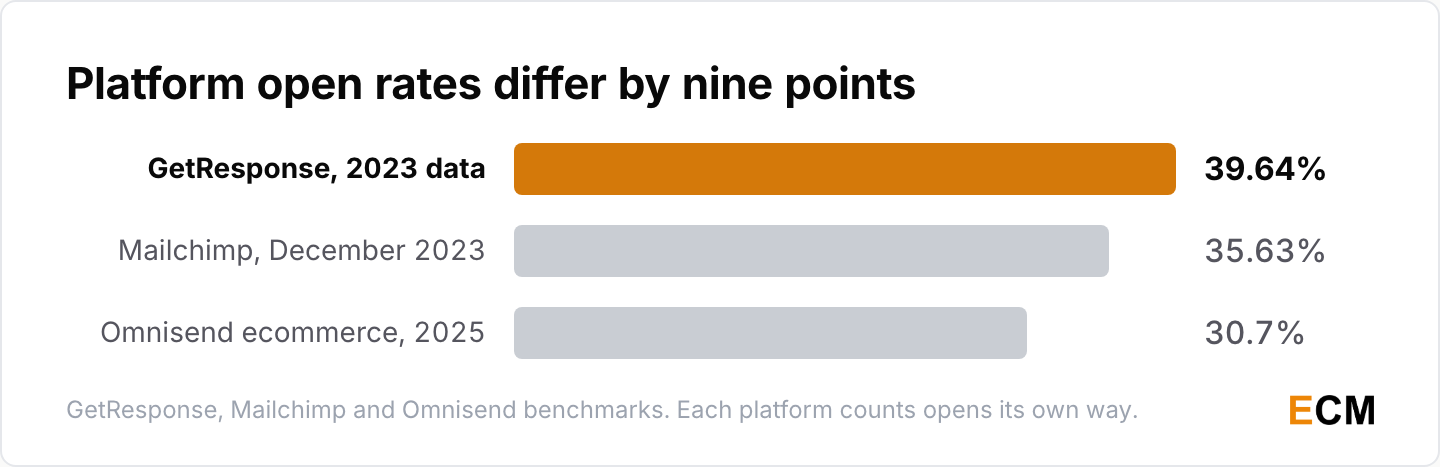
- GetResponse reports a global average open rate of 39.64%, a 3.25% click-through rate and an 8.62% click-to-open rate, from more than 4.4 billion messages (GetResponse Email Marketing Benchmarks, 2023 send data).
- Mailchimp reports an all-industry average open rate of 35.63% and a 2.62% click rate, from data last updated in December 2023 (Mailchimp Email Marketing Benchmarks, December 2023).
- Omnisend’s ecommerce open rate reached 30.7% in 2025, up from 26.6% in 2024, the fifth rise in a row (Omnisend 2026 eCommerce Marketing Report, 2026).
- Constant Contact reported an all-industry average open rate of 30.35% as of May 2022, led by independent artists, writers and performers at 34.4%, education at 34.1% and travel and tourism at 32.6% (Constant Contact knowledge base, May 2022). Treat it as a 2022 reading, not a current benchmark.
Apple Mail and the Open Rate Problem
An open no longer proves a person read anything. Apple’s Mail Privacy Protection loads the tracking pixel on the reader’s behalf.
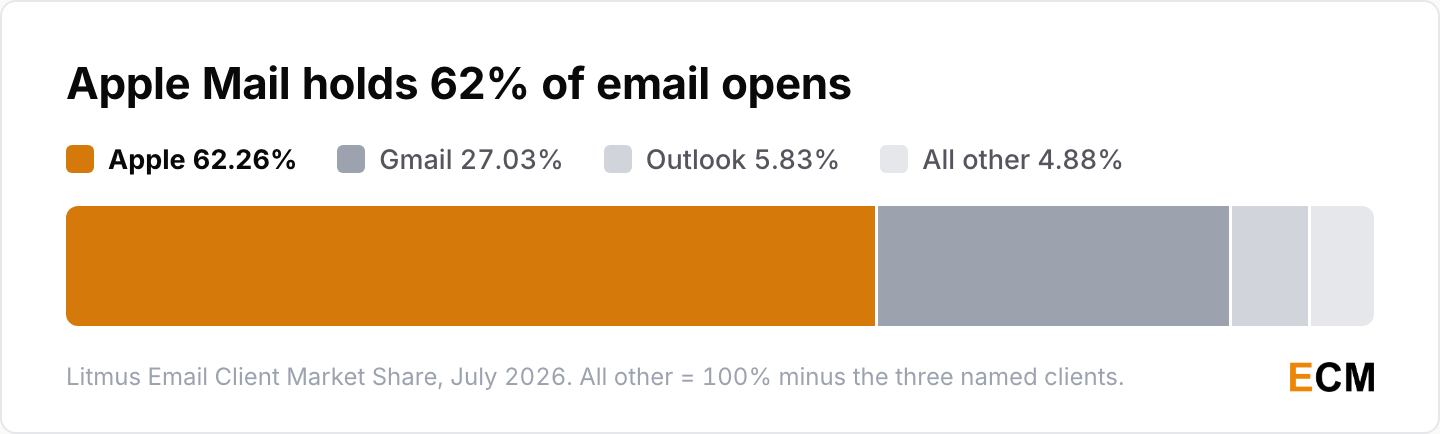
- Apple Mail took 62.26% of tracked opens in July 2026, Gmail 27.03% and Outlook 5.83%, leaving 4.88% for every other client combined, Yahoo Mail’s 2.59% included (Litmus Email Client Market Share, July 2026).
- Apple Mail and Gmail together account for nearly 90% of email client market share, and Apple’s Mail Privacy Protection now affects roughly 55% to 60% of all email opens (Litmus Email Client Market Share, 2026).
- GetResponse’s open rate rose 12.84 percentage points in a year, and GetResponse credits it partly to Apple’s auto-opens and partly to real engagement, citing higher click-through and click-to-open rates (GetResponse Email Marketing Benchmarks, 2023 send data).
Email Subject Line Statistics
On GetResponse’s platform, the plain subject line won. Personalization and emojis both lost on opens and on clicks.
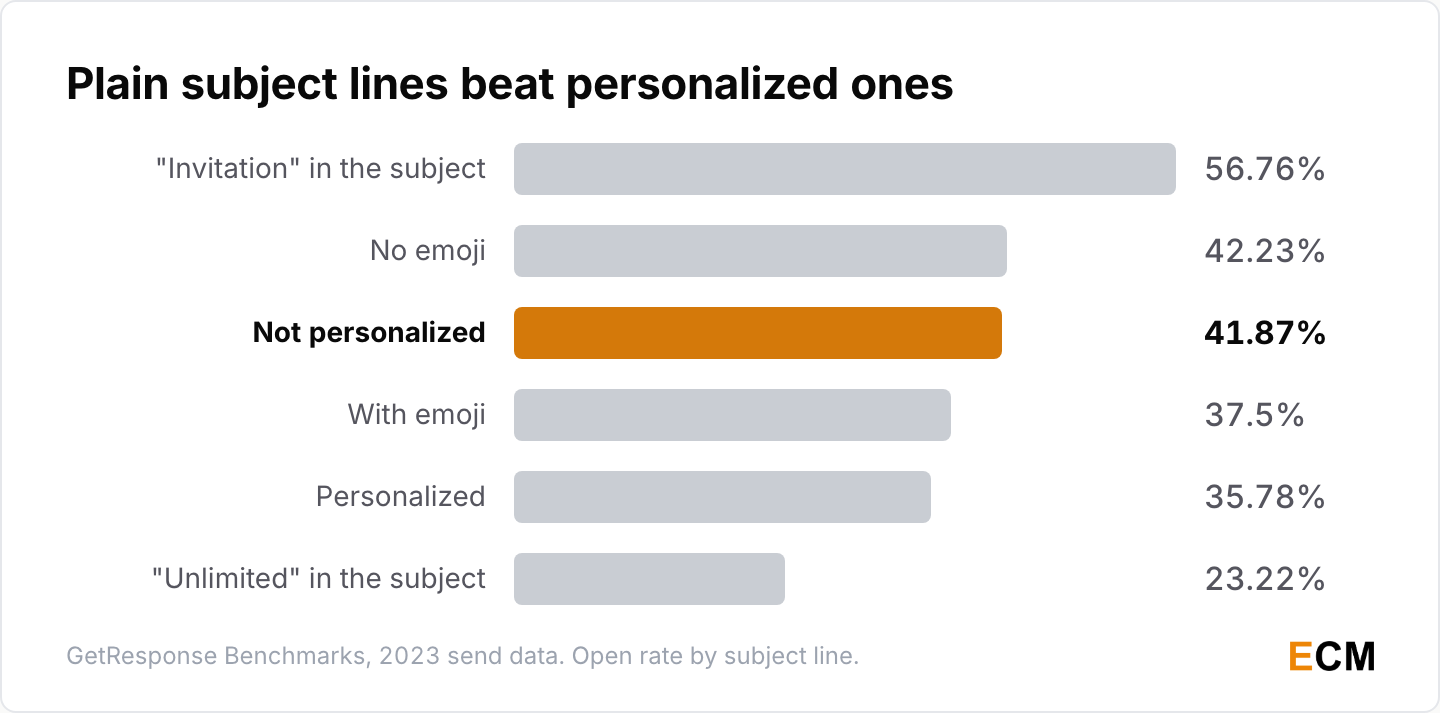
- Non-personalized subject lines drew a 41.87% open rate against 35.78% for personalized ones, and a 4.23% click-through rate against 2.11% (GetResponse Email Marketing Benchmarks, 2023 send data).
- Subject lines without emojis drew a 42.23% open rate against 37.5% with them, and 4.16% clicks against 3.32% (GetResponse Email Marketing Benchmarks, 2023 send data).
- The word “invitation” posted the highest open rate of any phrase GetResponse tracked at 56.76%, against 23.22% for “unlimited” (GetResponse Email Marketing Benchmarks, 2023 send data). Our email subject line tester scores a line before you send it.
Welcome Emails and the Best Day to Send
Welcome emails get opened more than any other type GetResponse tracks. Send day matters far less than most calendars assume.
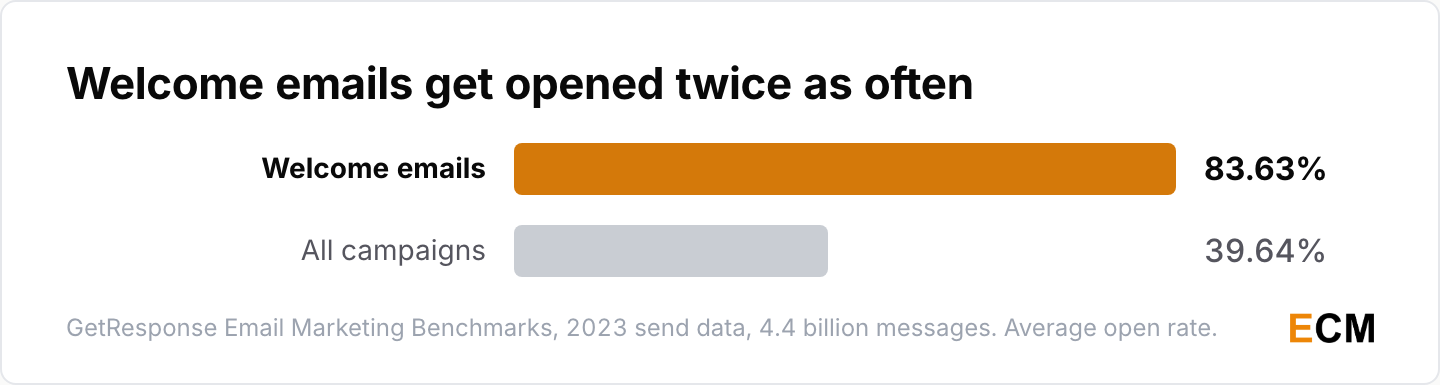
- Welcome emails averaged an 83.63% open rate, a 16.60% click-through rate and a 19.85% click-to-open rate, 2.1 times the all-campaign open rate on the same platform (GetResponse Email Marketing Benchmarks, 2023 send data).
- Mondays see the highest email open rates at 22.0% and Sundays the lowest at 20.3%, a spread under two points across the week (Campaign Monitor Email Marketing Benchmarks, 2022 report on 2021 sends).
- 97% of marketers use at least one interactive element in their emails (Litmus and Validity, State of Email 2025, June 2025), yet only 47% of companies apply basic accessibility such as alt text (Litmus, State of Email 2025 recap, 2025). Accessibility is the cheapest of these gaps to close, since alt text is a template change, not a redesign.
Email Marketing Automation and Email Personalization Statistics
Two consecutive years of Omnisend send data point the same way. If you fund one marketing automation project this year, the numbers point at triggered flows.
Automated Emails Versus Scheduled Email Marketing Campaigns
Automated emails are a sliver of volume and a large share of the money.
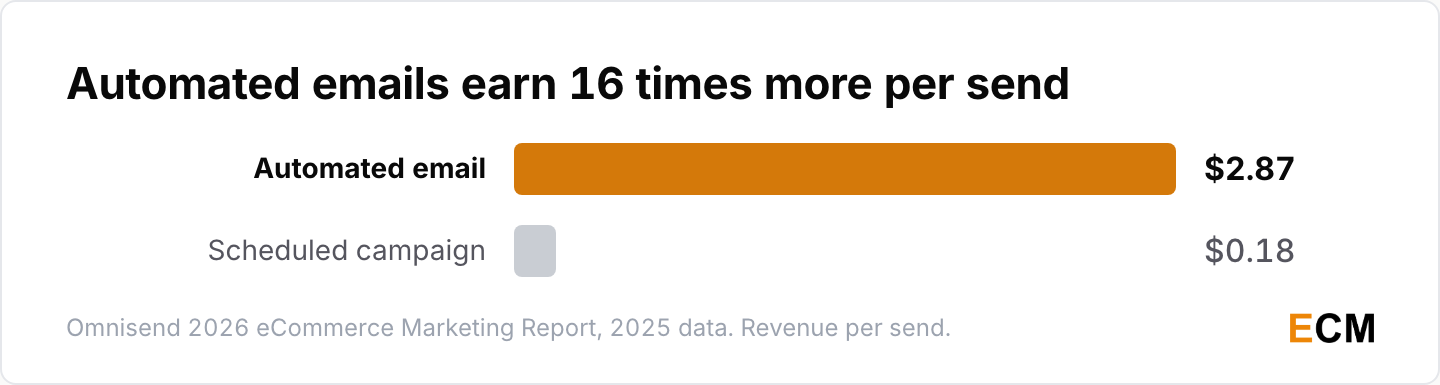
- Automated emails made up 2% of all sends but generated 30% of email-driven revenue in 2025, earning $2.87 per send against $0.18 for scheduled campaigns (Omnisend 2026 eCommerce Marketing Report, 2026).
- Automated messages delivered 24% higher open rates, 6 times stronger click engagement and 19 times higher conversion rates than scheduled campaigns (Omnisend 2026 eCommerce Marketing Report, 2026).
- A year earlier, automated emails drove 37% of email sales from 2% of volume, across close to 24 billion emails (Omnisend 2025 eCommerce Marketing Report, 2024 data).
- 79% of marketers said they use automation; among them, 82% use it for triggered emails, 67% for drip or nurture campaigns and 56% for segmentation (Litmus 2021 State of Email, 2021).
What Is the 80/20 Rule in Email Marketing
The 80/20 rule says a small share of effort drives most results. Omnisend’s data shows that shape at the top of ecommerce.
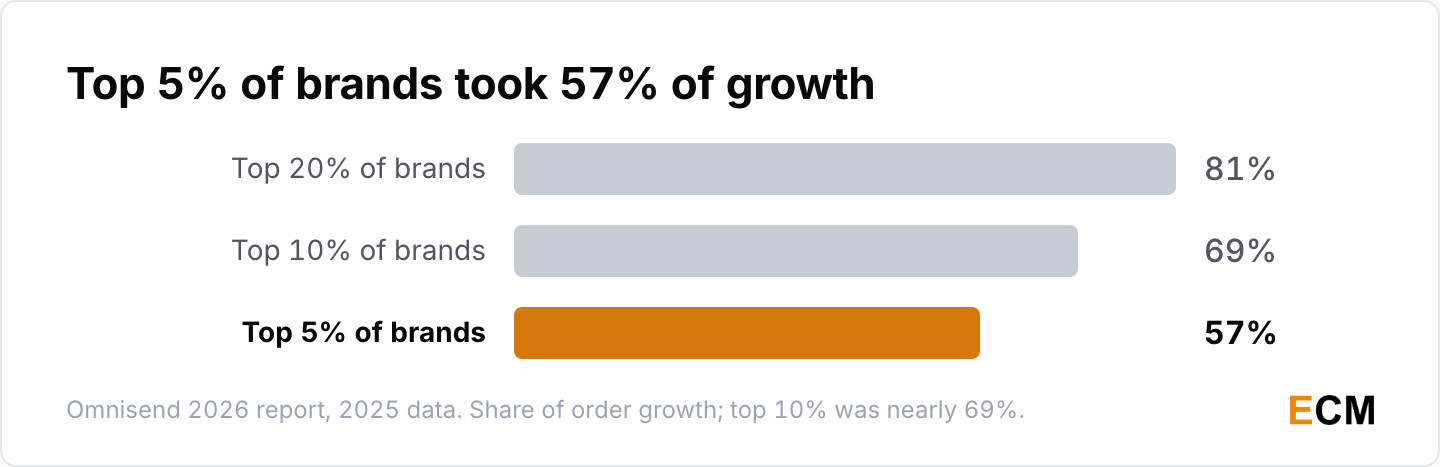
- The top 5% of brands generated 57% of ecommerce order growth in 2025, the top 10% nearly 69% and the top 20% drove 81% (Omnisend 2026 eCommerce Marketing Report, 2026).
- Global ecommerce order volume across all channels grew 98% in 2025, climbing from +82% in the first quarter to +146% in the fourth (Omnisend 2026 eCommerce Marketing Report, 2026).
- Abandoned cart and welcome messages together drove 76% of all automation-generated orders (Omnisend 2026 eCommerce Marketing Report, 2026).
Conversion Rate by Automation and Market
Conversion varies more by market than most benchmark tables show. The UK converts at 1.8 times the global rate.
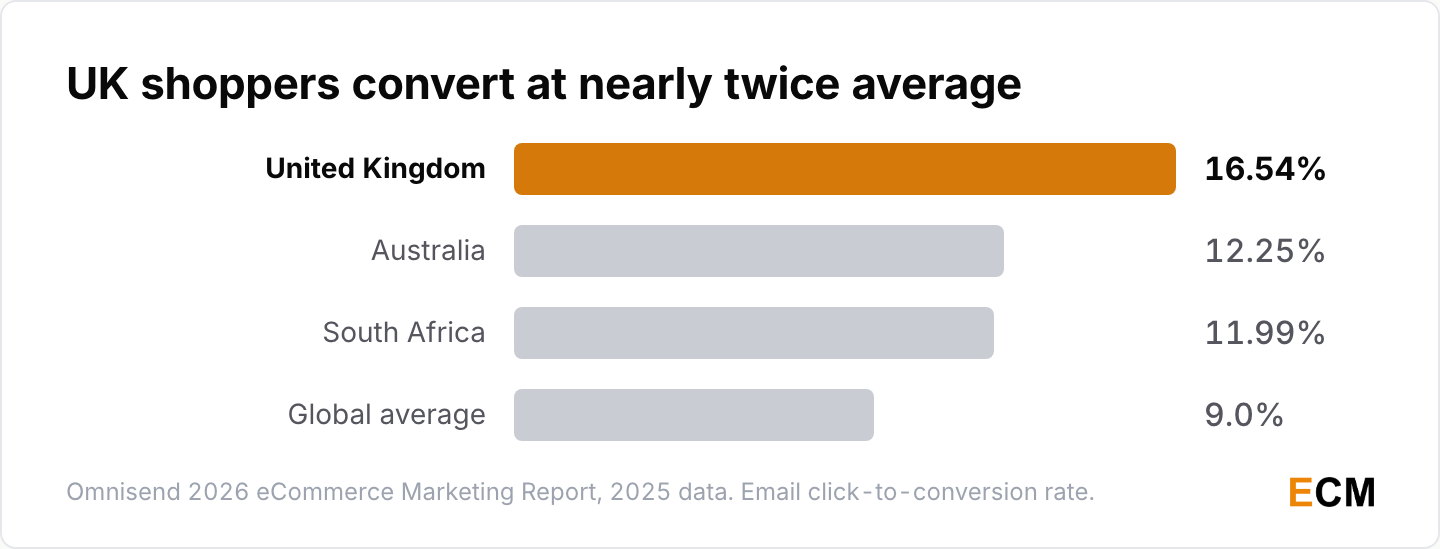
- Email click-to-conversion ran highest in the United Kingdom at 16.54%, followed by Australia at 12.25% and South Africa at 11.99%, against a 9.0% global average (Omnisend 2026 eCommerce Marketing Report, 2026).
- The highest-converting industries in 2025 were games at 15.1%, food and drink at 14.9% and health at 14.8% (Omnisend 2026 eCommerce Marketing Report, 2026).
- Back-in-stock emails posted the highest conversion rate of any automation at 6.46%, and birthday automations produced an average order value of $744.37, more than 4 times the platform average (Omnisend 2026 eCommerce Marketing Report, 2026).
How Important Are Personalization and Segmentation
Shoppers say they reward personalization, yet most email personalization is still a first-name token, and personalized subject lines lost on GetResponse.
- 80% of consumers are more likely to make a purchase when brands offer personalized experiences (Epsilon, January 2018, 1,000 US consumers aged 18 to 64).
- 53% of marketers use basic personalization, such as including a name in email copy (HubSpot, 2026).
- Segmented emails drive 30% more opens and 50% more click-throughs than unsegmented ones (HubSpot Marketing Statistics, citing HubSpot’s 2023 State of Marketing Report, 2023). It is a pre-2024 figure, so quote it with the year.
AI Email Marketing Statistics and Trends for 2026
Figures on AI in email marketing are high, self-reported, and mostly collected by companies selling AI features. I read them as intent; the production-time data is the harder number.
How Many Marketers Use AI in Email
Intent runs high in every survey, and the forecasts run ahead of anything measured.
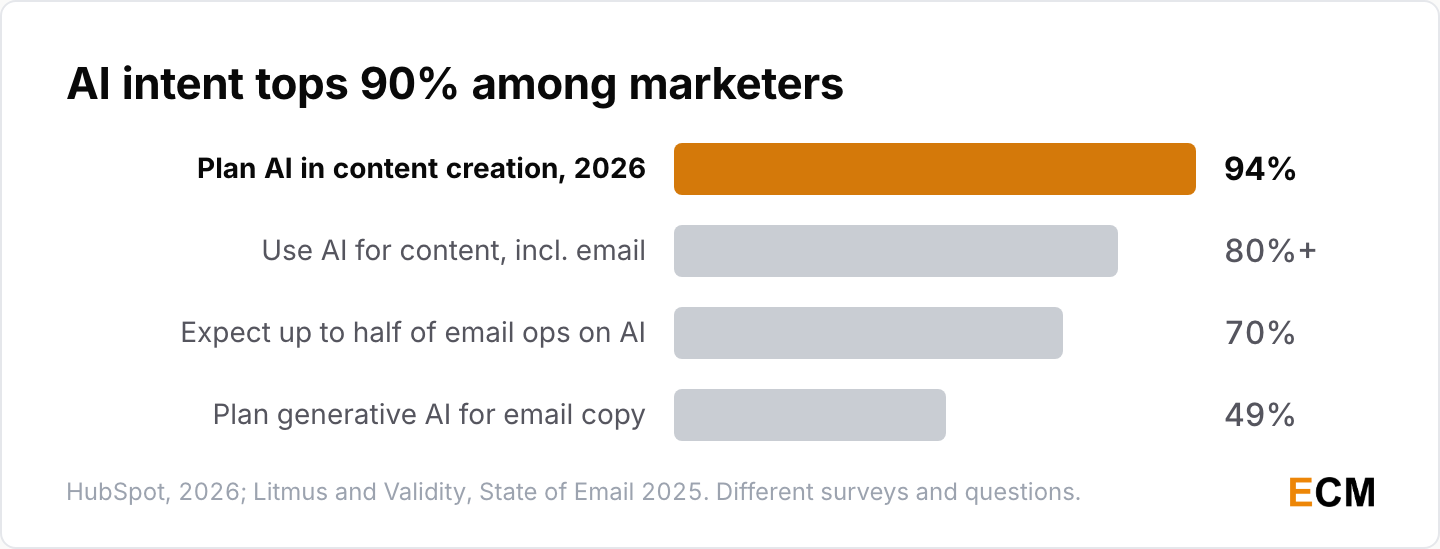
- 94% of marketers plan to use AI in their content creation processes in 2026, blog articles included, so it is not an email-only figure, and over 80% already use AI for content creation, email copy included (HubSpot Marketing Statistics, 2026).
- 70% of marketers predicted up to half of their email operations would be AI-driven by 2026, and 18% expected AI to handle 50% to 75% of email tasks (Litmus and Validity, State of Email 2025, June 2025).
- 49% of marketers planned to use generative AI for static copy, and use of AI image generation rose 340% in a year (Litmus and Validity, State of Email 2025, June 2025).
What AI Changed About Email Production
The measurable shift is speed. Email builds that took more than two weeks became rare in a single year.
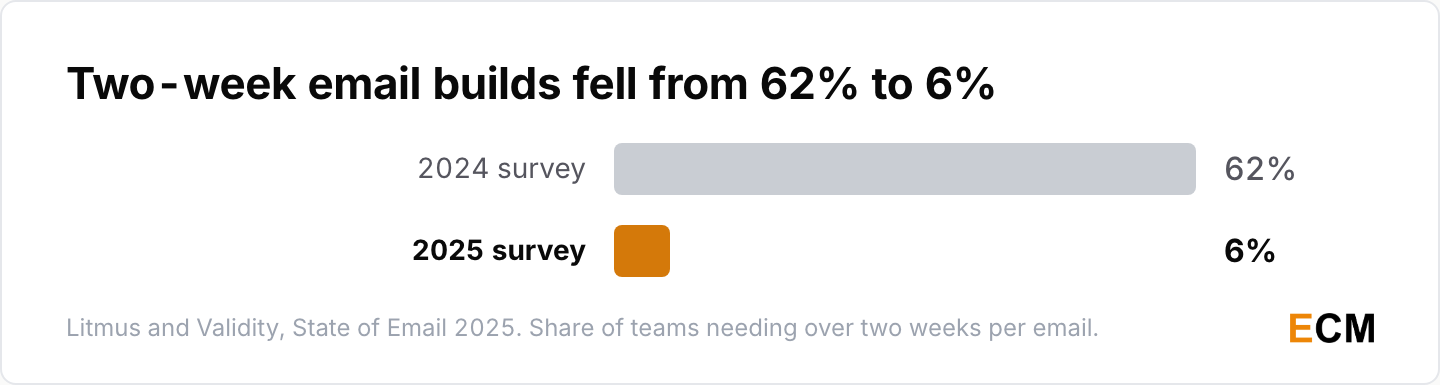
- Only 6% of teams needed more than two weeks to produce an email in 2025, against 62% in 2024 (Litmus and Validity, State of Email 2025, June 2025).
- 62.7% of marketers say the market needs more unique, human-centered content to compete with AI content (HubSpot State of Marketing, 2026).
- Klaviyo launched Marketing Agent and Customer Agent, both built on large language models, in September 2025 (Klaviyo Form 10-K, FY2025).
Email Usage, B2B, Newsletter and Mobile Email Marketing Statistics
The audience is huge and still growing. Most benchmark data skews ecommerce, so the B2B figures below are thinner and older.
Email Usage and the Number of Global Email Users
The audience is close to everyone online, and the one forecast everybody quotes comes from a single firm.
- Worldwide email users will grow from over 4.4 billion in 2024 to over 4.9 billion by 2028, counting business and consumer users (The Radicati Group, 2024).
- Statista valued the global email marketing market at $7.5 billion in 2020 and projected $17.9 billion by 2027 (Statista, 2020). On its current revenue measure, Statista projected 2024 email marketing revenue to pass $9.5 billion (Statista, 2024).
B2B Email Marketing Statistics
B2B email marketers mail rarely and impersonally, which leaves room for anyone willing to send from a real person.
- B2B companies send one email campaign every 25 days on average, based on 4,494 campaigns received over 90 days (SuperOffice, updated October 2022).
- 89% of B2B email campaigns were sent from a company name rather than a person’s name (SuperOffice, updated October 2022).
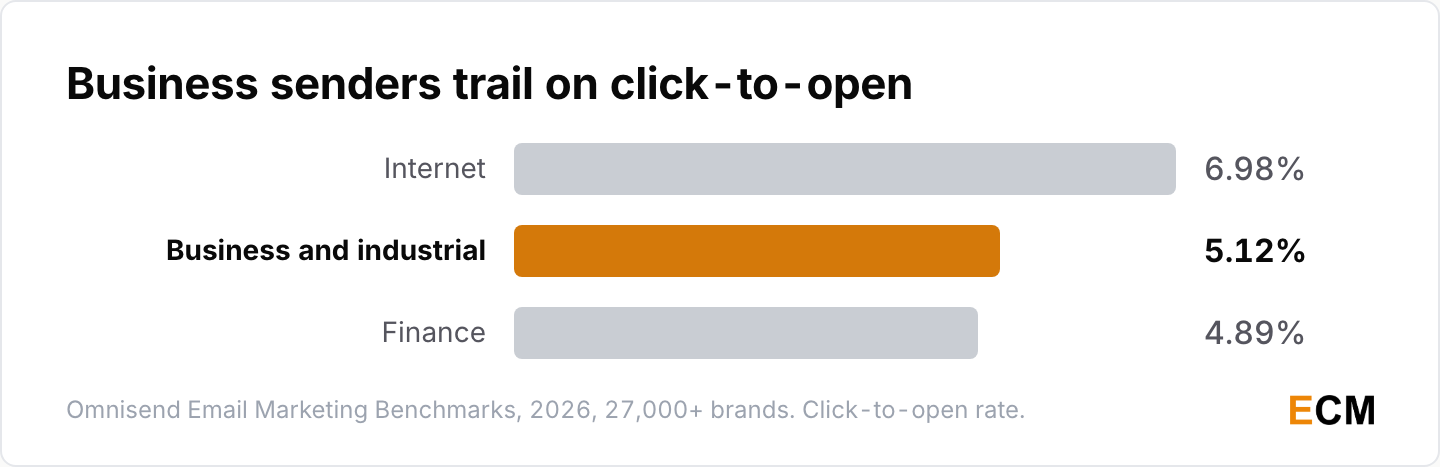
- Among Omnisend’s industry categories, business and industrial senders posted a 5.12% click-to-open rate and finance 4.89%, with internet leading at 6.98% (Omnisend Email Marketing Benchmarks, 2026, 27,000+ brands). These are industry verticals, not a true B2B split.
Mobile Email and Inbox Habits
Email is read on the phone first, and reading newsletters is not a young person’s habit or an old one.
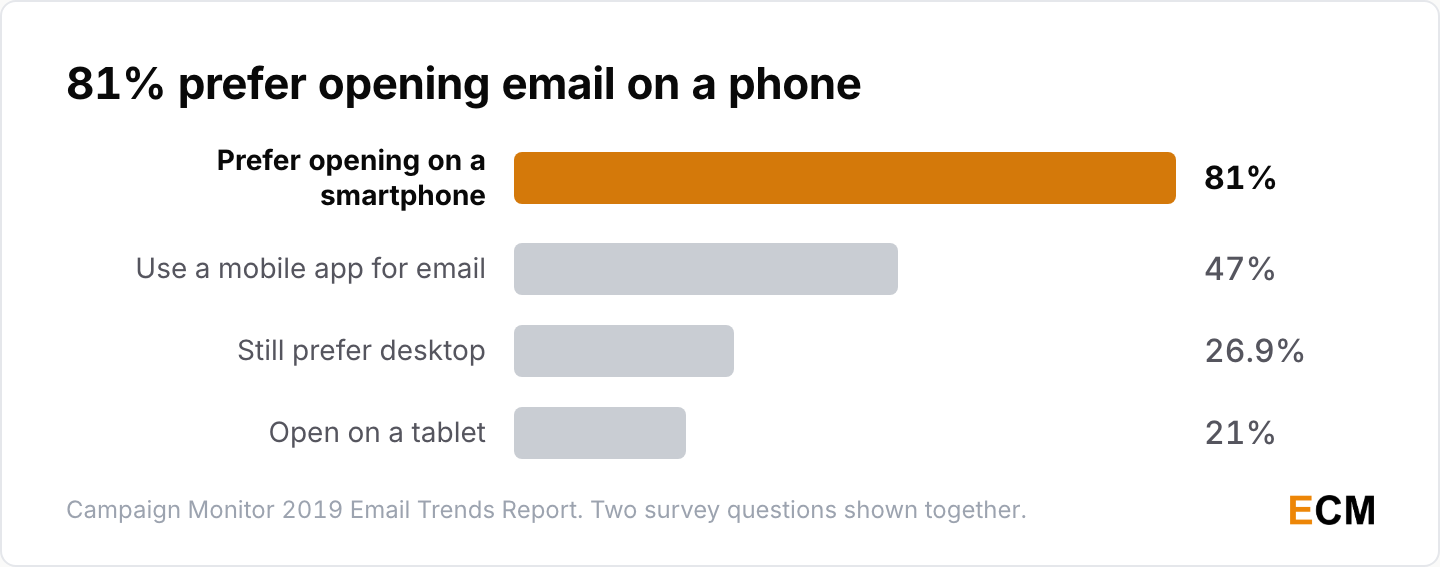
- 81% of people prefer to open emails on their smartphones and 21% open on tablets; asked separately, 47% said they use a mobile app to check email and 26.9% still prefer desktop (Campaign Monitor 2019 Email Trends Report, 2019).
- 30% of US adults at least sometimes get news from email newsletters they subscribe to, and the share barely moves by age, from 28% of 18 to 29 year olds to 32% of 50 to 64 year olds (Pew Research Center, February 2026).
Newsletter Platform Statistics
Newsletters became a paid product, and both big platforms grew paid subscriptions fast.
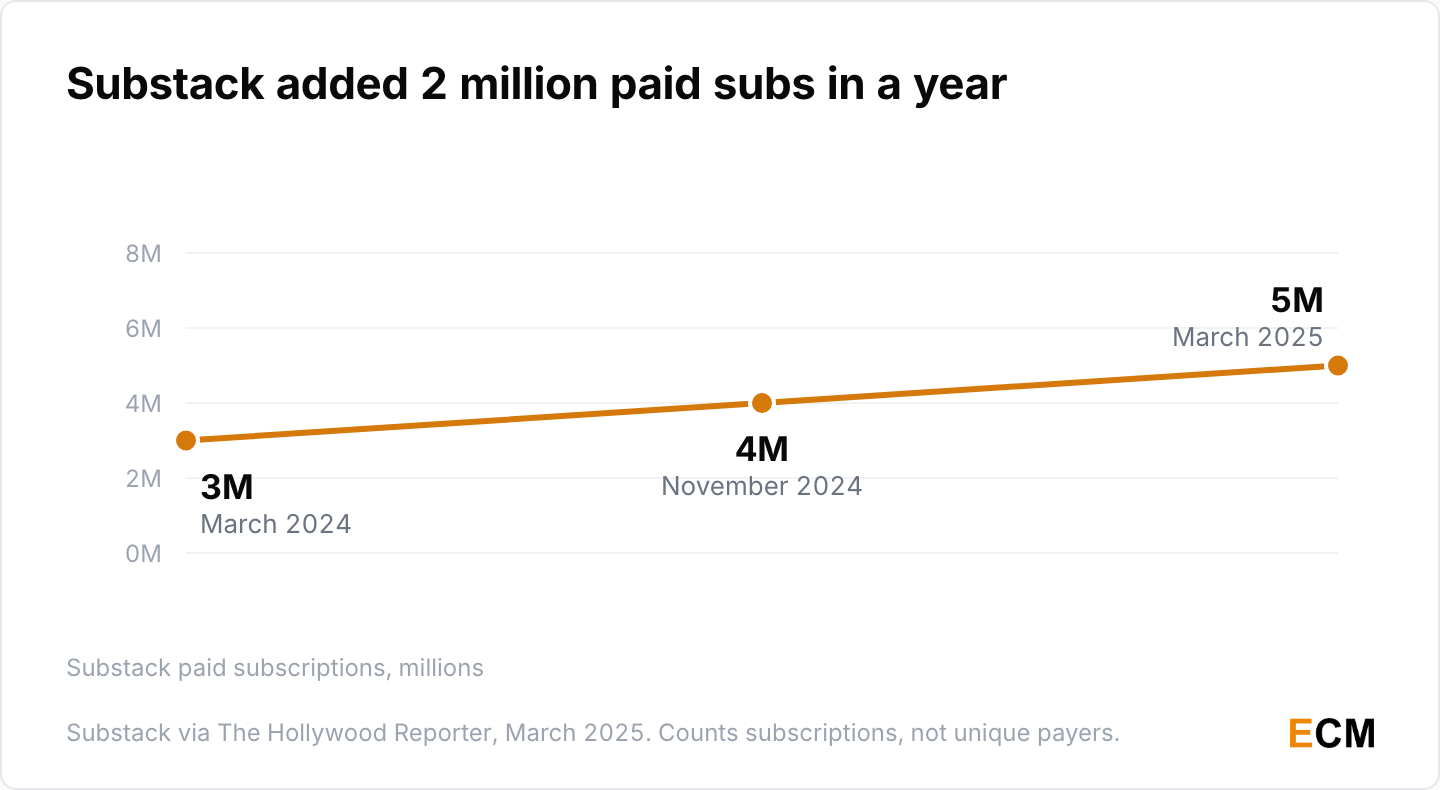
- Substack passed 5 million paid subscriptions in March 2025, up from 4 million four months earlier and 3 million a year before (The Hollywood Reporter, citing Substack, March 2025), then raised a $100 million Series C at a $1.1 billion valuation (Axios, July 2025). The subscriber figures count subscriptions, not unique paying readers.
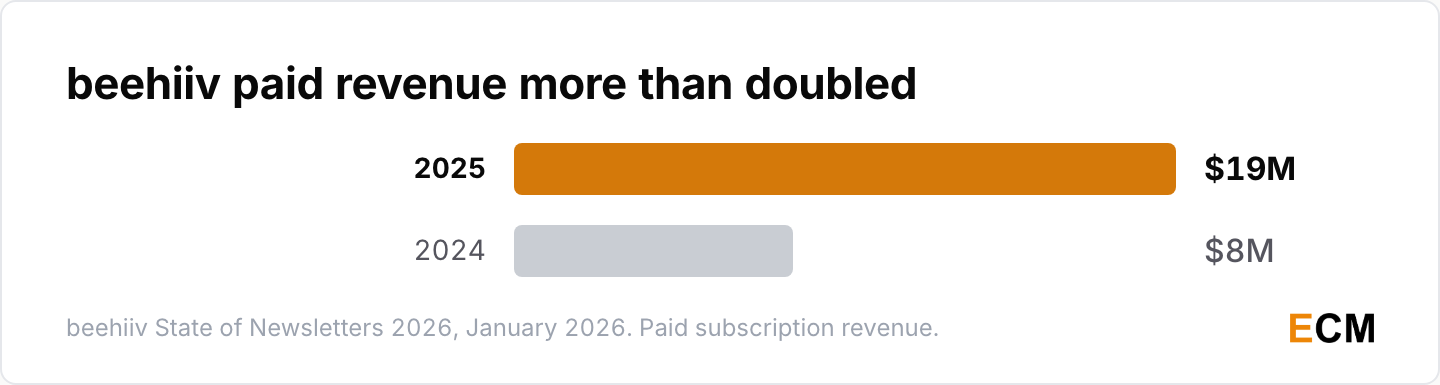
- Paid subscriptions on beehiiv generated $19 million in 2025 against $8 million in 2024, a 138% jump, the median newsletter launched in 2025 earned its first dollar in 66 days, and open rates reached 41% and above (beehiiv State of Newsletters 2026, January 2026). That open rate is a threshold, not a platform mean.
Email Deliverability Statistics and Sender Requirements
All three major mailbox providers made authentication mandatory for bulk senders between February 2024 and May 2025. If deliverability slipped since, check SPF, DKIM and DMARC before touching the creative.
Gmail and Yahoo Sender Requirements
Gmail publishes hard numbers. Yahoo enforces the same rules without a published volume line.
- Senders of 5,000 or more messages a day to personal Gmail accounts must authenticate with SPF and DKIM, publish a DMARC policy, support one-click unsubscribe and keep reported spam below 0.30% (Google Email sender guidelines, effective February 2024).
- Yahoo enforced parallel authentication requirements from the first quarter of 2024 and classifies bulk senders by behavior rather than a volume threshold (Yahoo Postmaster, October 2023).
- 63% of senders were at least somewhat familiar with the new Gmail and Yahoo requirements, and in a separate Mailgun consumer survey more than 72% of respondents said they use Gmail (Mailgun State of Email Deliverability, 2024).
Microsoft Outlook Sender Requirements
Microsoft joined in 2025 with the same 5,000-a-day line as Gmail.
- Senders of 5,000 or more emails a day to outlook.com, hotmail.com and live.com addresses must pass SPF, DKIM and DMARC, effective May 5, 2025 (Microsoft Defender for Office 365, April 2025).
- An April 29, 2025 update replaced the announced junk-folder grace period with outright rejection, returning “550; 5.7.515 Access denied, sending domain [SendingDomain] does not meet the required authentication level” from May 5, 2025 (Microsoft Defender for Office 365, April 2025). The original junk-folder wording still appears higher up the same post, so check which penalty a source describes.
Spam Filtering and List Decay
Deliverability is maintenance, not setup. Filters get stricter and every email list loses addresses each year whether you touch it or not.
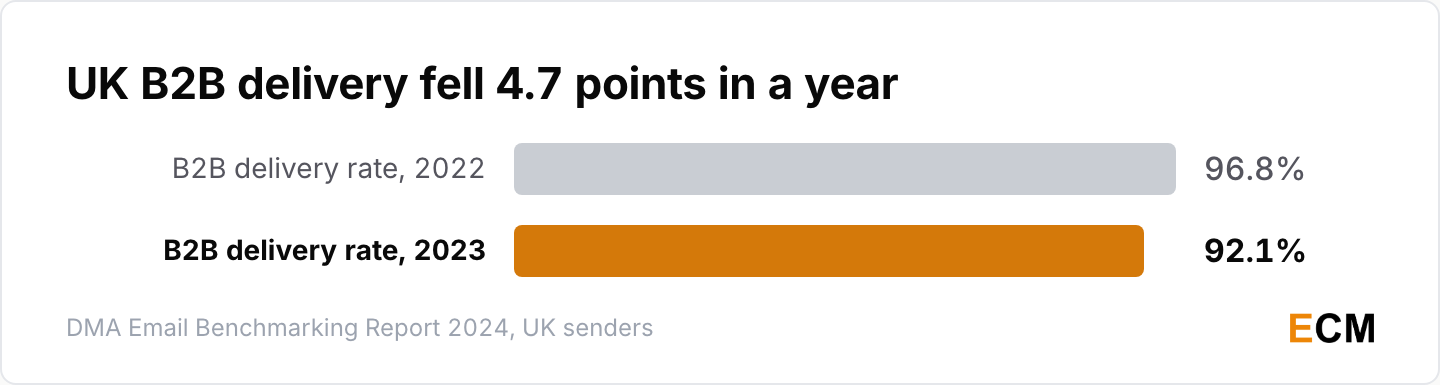
- UK B2B delivery rates dropped 4.7 points in a single year, from 96.8% in 2022 to 92.1% in 2023 (DMA Email Benchmarking Report 2024, 2024). Across all UK senders, delivery reached 98% in 2024, carried mainly by B2C at 99.2% (DMA Email Benchmarking Report 2025, 2025). B2B recovered later: the 2026 edition shows its delivered rate climbing from 90.7% to 95.6% (Validity on the DMA Email Benchmark Report 2026, July 2026).
- Gmail’s defenses block nearly 15 billion unwanted emails every day and stop more than 99.9% of spam, phishing and malware before it reaches the inbox (Google, October 2023).
For the wider picture, I keep companion pages of content marketing statistics and SEO statistics.
Frequently Asked Questions
Is email marketing still effective in 2026?
Yes. Klaviyo’s revenue grew 31.6% to $1,234.0 million in 2025 (Klaviyo Form 10-K, 2026), and automated emails earned $2.87 per send (Omnisend, 2026). Four in five marketers would give up social media before email (Litmus, 2020).
What is the average email open rate in 2026?
It depends on who measures. GetResponse reports 39.64% (GetResponse, 2023 data), Mailchimp 35.63% (Mailchimp, December 2023 data) and Omnisend 30.7% for ecommerce (Omnisend, 2025 data). Apple’s Mail Privacy Protection inflates all three, so compare against your own history, not an industry average.
What is the average ROI for email marketing?
Litmus’s headline figure is $36 for every $1 spent (Litmus, 2020). Industry figures run from 32:1 in media to 45:1 in retail (Litmus, 2020 survey). All are self-reported by marketers, so measure your own before benchmarking.
Is the “$42 for every $1” email ROI stat still accurate?
Not as a current figure. It comes from one UK panel reporting £42.24 per £1 in 2018 (DMA Marketer Email Tracker 2019, 197 UK marketers). Litmus’s global figure was 42:1 in 2019 and 36:1 in 2020 (Litmus, 2020). For a deck, quote $36 with its year attached.
What changed with Gmail, Yahoo and Microsoft sender requirements?
Gmail and Microsoft both require SPF, DKIM and DMARC from senders of 5,000 or more messages a day (Microsoft, 2025), and Gmail adds one-click unsubscribe and a spam rate below 0.30% (Google, 2024). Yahoo applies the same rules without a volume line (Yahoo, 2023). Microsoft rejects non-compliant mail with a 550; 5.7.515 error from May 5, 2025 (Microsoft, 2025).
How many email users are there worldwide?
Over 4.4 billion as of 2024, rising to over 4.9 billion by 2028, according to The Radicati Group (Radicati, 2024). Its model is proprietary, so treat the figures as a forecast rather than a count.
Written by
Editorial Staff
The Editorial Staff represents the writers, editors, and content creators who have worked (or work) at Elite Content Marketer. The experimenter-in-chief behind the team is Chintan Zalani, who has close to a decade of experience trying to make sense of the content marketing industry. Started in 2019, Elite Content Marketer is on a mission to help creators build sustainable businesses.
Related Articles

Marketing Data
58 AI Personalization Statistics for 2026: ROI + Adoption
58 AI personalization statistics for 2026: 78% of marketers can’t make enough personalized content, and 87% of brands rate it good while 29% of consumers agree.
Oct 2, 2026Read more →
Marketing Data
60 AI Workflow Automation Statistics for 2026
60 AI workflow automation statistics for 2026: 37% of respondents see any EBIT impact from AI, 6% are high performers, and agents scale at big firms.
Oct 1, 2026Read more →
Marketing Data
AI Image Generation Statistics 2026: 60 Data Points
60 AI image generation statistics for 2026: people now create more than 3 billion images a week with ChatGPT Images and OpenAI’s API.
Sep 30, 2026Read more →