Forty-five percent of US consumers now ask ChatGPT or another AI tool for local business recommendations, up from 6% a year earlier (BrightLocal, February 2026). No set of online review statistics moved further in twelve months.
59 Online Review Statistics for 2026
 Written by Editorial Staff
Key Takeaways
- Generative AI became a mainstream discovery channel in one year. Use of AI tools for local recommendations went from 6% to 45%, while Google’s share of review readers fell from 83% to 71% (BrightLocal Local Consumer Review Survey 2026, February 2026).
- Almost everyone reads reviews, and more people now read them every time. 97% read reviews when browsing for a local business, and the share who always do jumped from 29% to 41% in a single wave (BrightLocal, February 2026).
- The best conversion evidence is nine years old. The 270% and 380% figures everyone quotes come from a 2017 study nobody has repeated (Spiegel Research Center, Northwestern Medill, June 2017). Give the year when you give the number.
- Platform fake-review rates measure detection, not prevalence. Trustpilot removed 7.4% of 2024 submissions (Trustpilot Trust Report 2025, May 2025), while Pangram flagged 3% of front-page Amazon reviews as AI-written (Pangram Labs, May 2026). Three definitions, three different counts.
- Nobody spots an AI-written review reliably. Human evaluators averaged 50.8% accuracy, which is chance, and seven leading language models did no better (arXiv preprint, June 2025).
- Fake reviews are now illegal on both sides of the Atlantic, with US civil penalties up to $53,088 per violation (Federal Register, January 2025) and UK penalties reaching 10% of turnover (Digital Markets, Competition and Consumers Act 2024, section 182).
Top Online Review Statistics for 2026
Five numbers carry the year, and four of them come from one annual survey.
Five Headline Review Statistics
The shape of the year is a mainstream channel appearing from almost nothing while the incumbent slips.
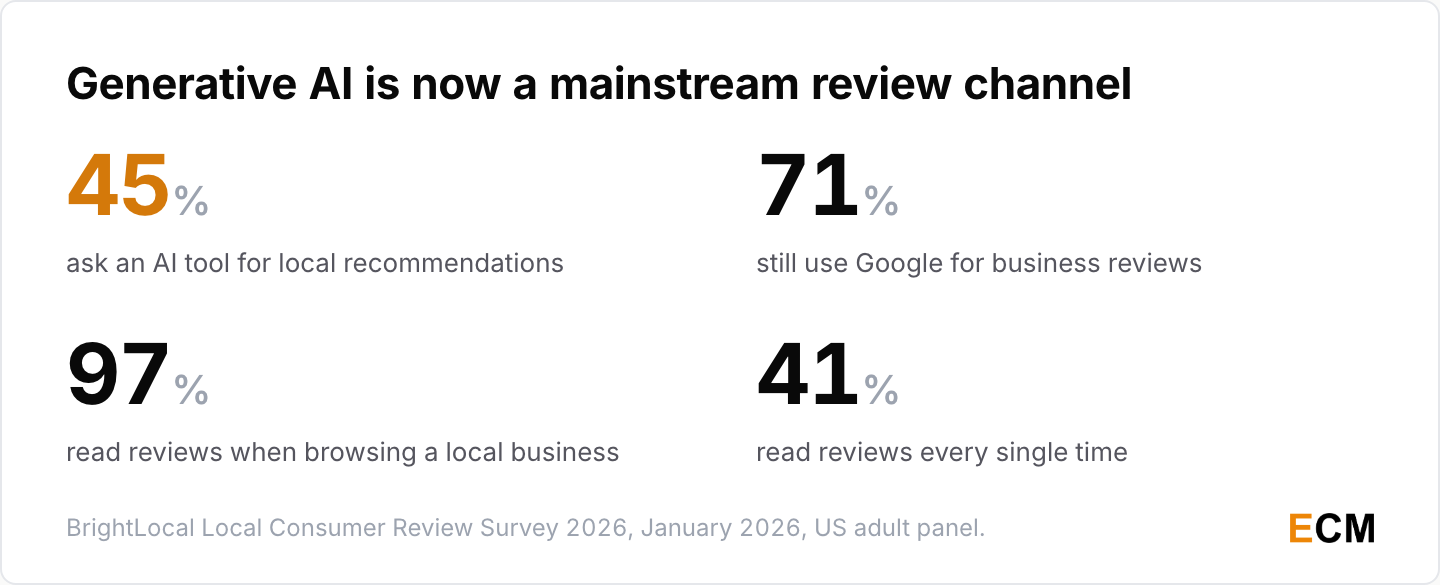
- 97% of US consumers read reviews when browsing for local businesses, and 41% now say they always do, up from 29% a year earlier (BrightLocal Local Consumer Review Survey 2026, February 2026, US adult panel).
- 45% use ChatGPT or another generative AI tool to find local business recommendations, up from 6% in the 2025 wave, which makes AI the third most popular recommendation source (BrightLocal, February 2026).
- 71% use Google for business reviews, down from 83% a year earlier, while Apple Maps nearly doubled from 14% to 27% (BrightLocal, February 2026).
- Showing five reviews on a product page raised purchase likelihood 270% against the same page with none (Spiegel Research Center, Northwestern Medill, June 2017, with PowerReviews).
- 89% of consumers expect a business owner to respond to reviews, and 81% expect that response inside a week (BrightLocal, February 2026).
BrightLocal sells local SEO software, so its questions follow its customers’ problems. The same instrument has run since 2010, which makes the year over year moves sturdier than any single-year level. Spiegel measured purchases rather than intentions.
How Far Review Trust Has Fallen
The idea that a stranger’s review carries the weight of a friend’s recommendation has been in decline for five years.
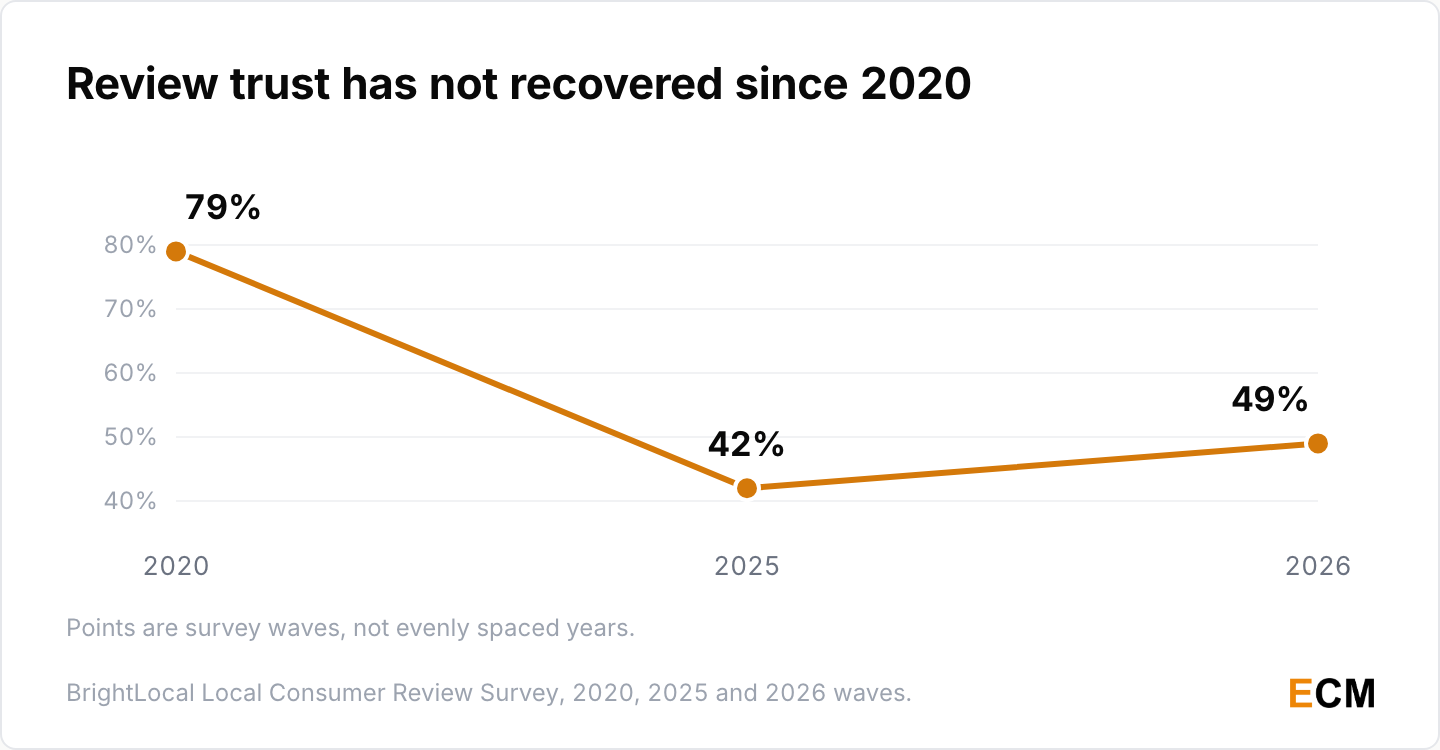
- 79% of consumers trusted online reviews as much as a personal recommendation in 2020, 42% did in 2025, and 49% do in 2026 (BrightLocal, February 2026).
- The 46% figure that circulated for years is BrightLocal’s 2023 wave, which sits close to where the series has landed again (BrightLocal 2023, February 2023).
- 71% of review readers do not count a star rating without text as a review at all, and 88% are more likely to trust written reviews over star-only ratings (Yelp and YouGov, February 2025, n=2,630 US adults).
A fall from 79% to the forties is the single most useful piece of context on this page. It means volume alone stopped working. The detail inside a review is now doing the persuading, which is why the star-only rating has quietly become worthless.
How Many People Read Online Reviews
Reading reviews is close to universal. The framing around that headline has tightened.
Reading Frequency in 2026
Universality is not the interesting part any more. Intensity is.
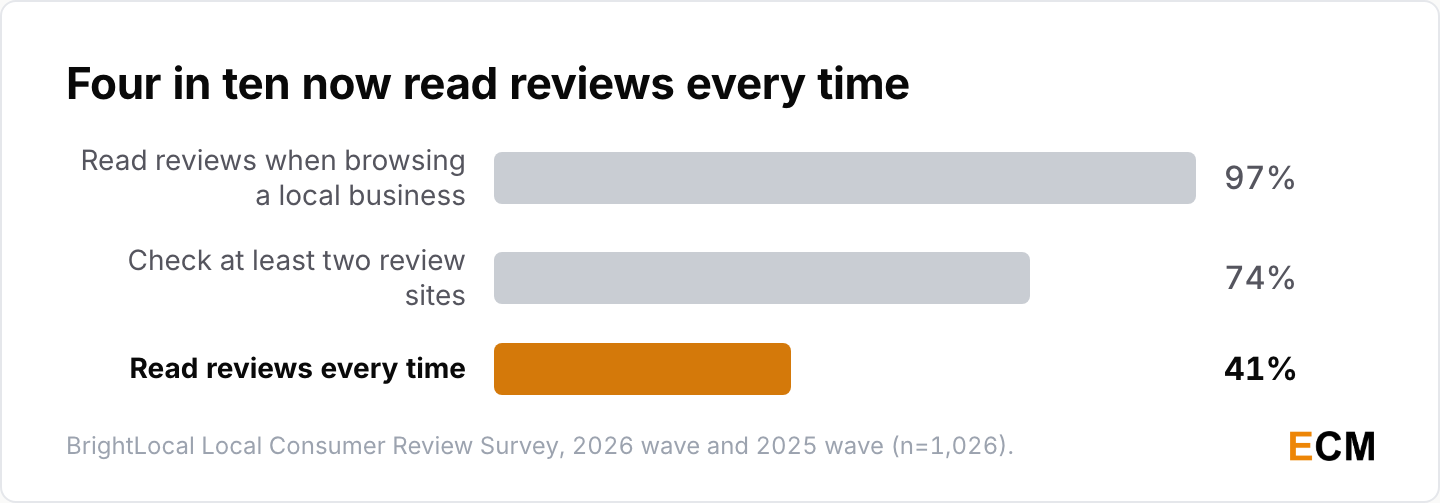
- 97% of US consumers read reviews when browsing for local businesses, and 41% read them every time, up from 29% in 2025 (BrightLocal, February 2026).
- 74% check at least two review sites before deciding (BrightLocal 2025, January 2025, n=1,026 US adults).
- An older figure still in circulation puts it at 99.9% of 6,538 US consumers reading reviews at least sometimes before shopping online, from PowerReviews in 2021; the company’s current published work measures visual content and Q and A instead.
The 97% gets recycled in decks every January without its qualifier. BrightLocal’s question wording has shifted across waves, so it is not strictly the same metric each year. Treat it as “reading reviews is universal,” not as a precision measurement you can trend across a decade.
Who Writes Online Reviews
If you have wondered what percentage of people leave reviews rather than read them, no current survey reports a clean single number. The 2026 wave reports volume bands.
- 20% of consumers wrote more than 10 reviews during 2025, and 7% wrote more than 50 (BrightLocal, February 2026).
- 22 million people wrote their first Trustpilot review in 2024, up 13% year over year, and 229,000 companies were reviewed there for the first time, up 35% (Trustpilot Trust Report 2025, May 2025).
- The 95% figure still quoted for people who leave reviews or would consider leaving one is a much older BrightLocal reading, and the current wave replaces it with those volume bands (BrightLocal, February 2026).
That small super-reviewer group matters more than its size suggests. A 7% minority writing 50 or more reviews a year sets the tone of every category page it touches, and those are the reviewers platforms work hardest to keep.
Photo and Video Review Statistics
The ecommerce product review statistics here come from retail panels rather than local-business surveys, so they measure a different shopper on a different page.
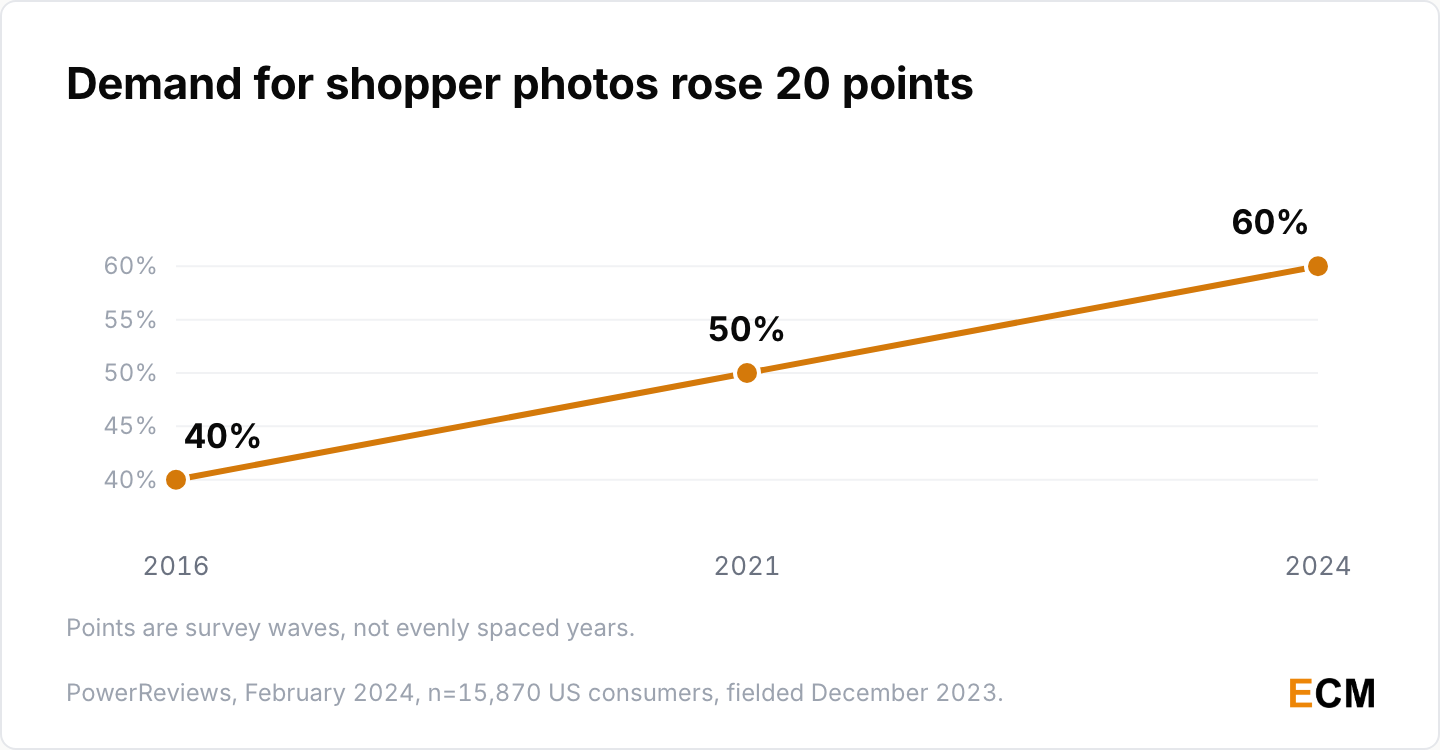
- 60% of consumers always look for visual content from other shoppers before buying, a 20-point rise on the 40% who said so in 2016, with 50% at the 2021 wave (PowerReviews, February 2024, n=15,870 US consumers, fielded December 2023).
- 91% are more likely to buy a product whose reviews include photos or video alongside text, up from 85% in 2021 and 72% in 2016 (PowerReviews, February 2024).
One caveat. PowerReviews sells the software that collects and displays those photos, so a finding that shopper visuals decide purchases is a finding about its own product. The direction of travel across three waves is the durable part, not the level.
What Shoppers Want From Q and A
The question section under a product is doing more work than most teams give it credit for.
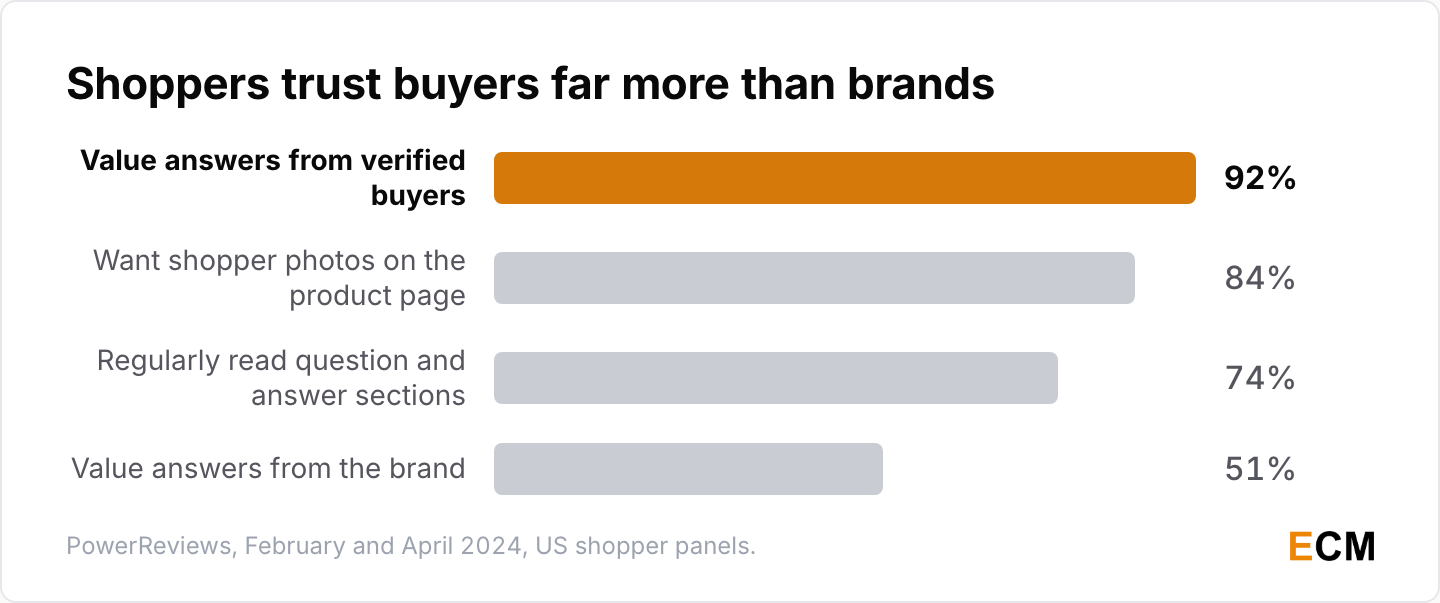
- 84% want shopper photos and videos included directly on the product detail page (PowerReviews, February 2024).
- 74% of online shoppers regularly read Q and A sections, 92% value answers from verified buyers, and 51% value answers from the brand (PowerReviews, How Q&A Boosts Shoppers’ Confidence and Conversion Rates, April 2024).
The 92 against 51 gap is the one I would act on first. Shoppers trust a stranger who bought the thing roughly twice as much as they trust you answering about your own product, which makes an unanswered question section a bigger conversion problem than most teams treat it as.
Where Consumers Read Online Reviews
Google still leads. The interesting part is what is eating into it.
Google’s Falling Share of Readers
A source that barely registered a year ago now sits second among the places people look.
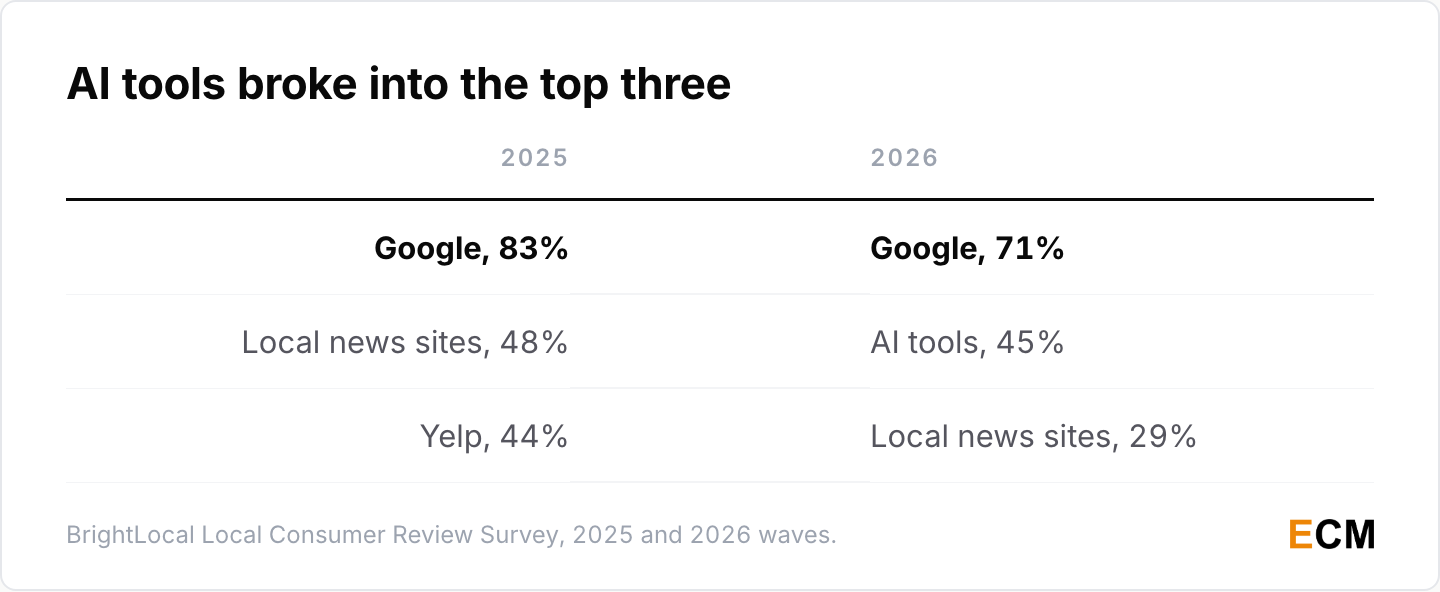
- Google’s share of review readers fell from 83% in 2025 to 71% in 2026, while local news sites collapsed from 48% to 29% (BrightLocal, February 2026).
- Generative AI tools went from 6% to 45% over the same year, and Apple Maps nearly doubled from 14% to 27% (BrightLocal, February 2026).
- The 87% Google-usage figure still quoted in roundups is BrightLocal’s 2023 reading, and the series has run 81% in 2024 and 83% in 2025 since (BrightLocal 2025, January 2025).
- 24% of global consumers used a generative AI tool to search for a product instead of a search engine, rising to 41% among 18 to 34 year olds, and 55% trust generative AI tools and shopping agents for at least some things, rising to 75% in that same younger group (Bazaarvoice Shopper Experience Index 2025, September 2025, n=7,000+ across six countries, fielded by Savanta in July 2025).
BrightLocal sells local SEO software, so a finding that says local search just got more complicated deserves a raised eyebrow. Bazaarvoice surveyed a different panel in a different set of countries and landed on the same shape. Two vendors with different commercial interests agreeing is the closest thing to corroboration this field offers.
Review Platform Statistics by Usage
A third of consumers read business reviews on YouTube and a fifth on TikTok, and most review policies ignore both.
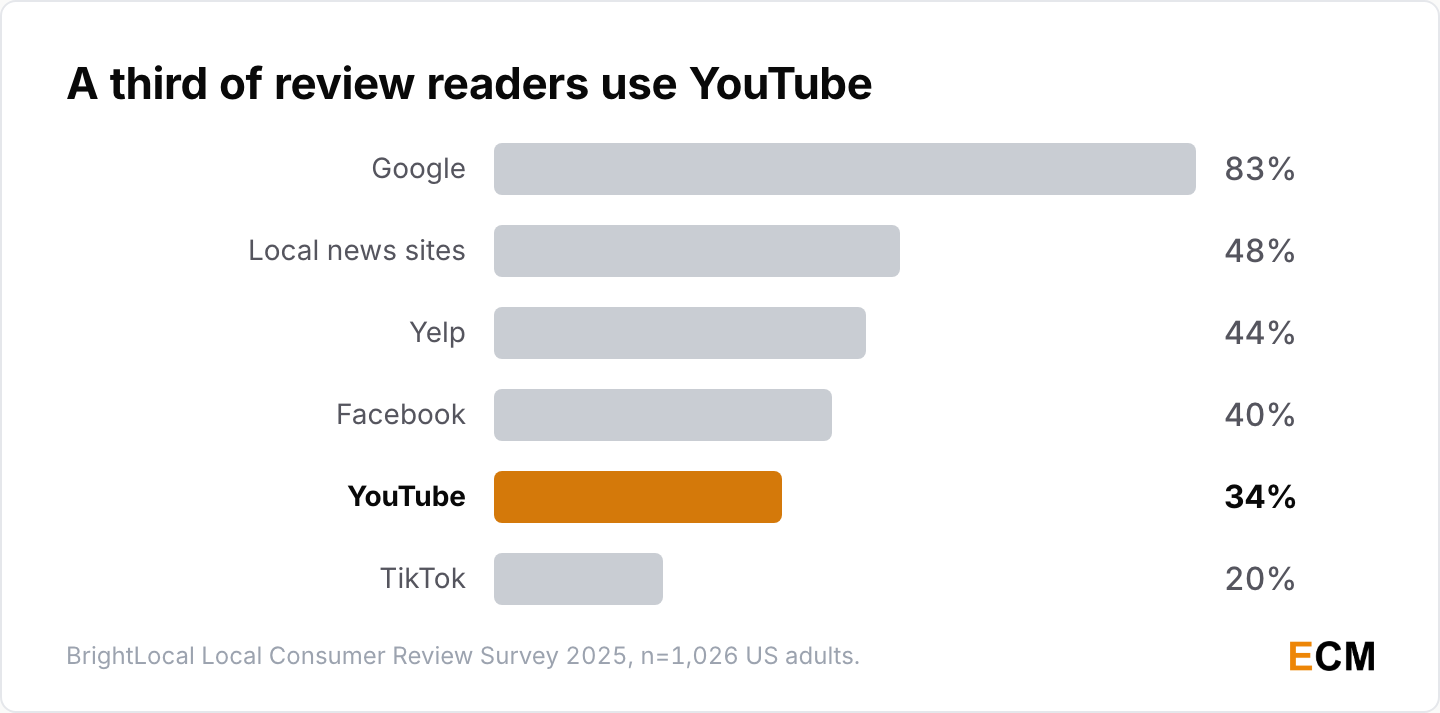
- 83% of consumers used Google to read business reviews in 2025, 48% used local news sites, 44% used Yelp and 40% used Facebook (BrightLocal 2025, January 2025, n=1,026).
- 34% used YouTube and 20% used TikTok (BrightLocal 2025, January 2025).
A written review policy that stops at Google, Yelp and Facebook misses the 34% who look on YouTube and the 20% who look on TikTok. If you want to catch mentions across platforms rather than checking dashboards one at a time, start with Brand24.
Review Volume by Platform
Cross-platform volume comparisons are messy because every platform counts a different thing.
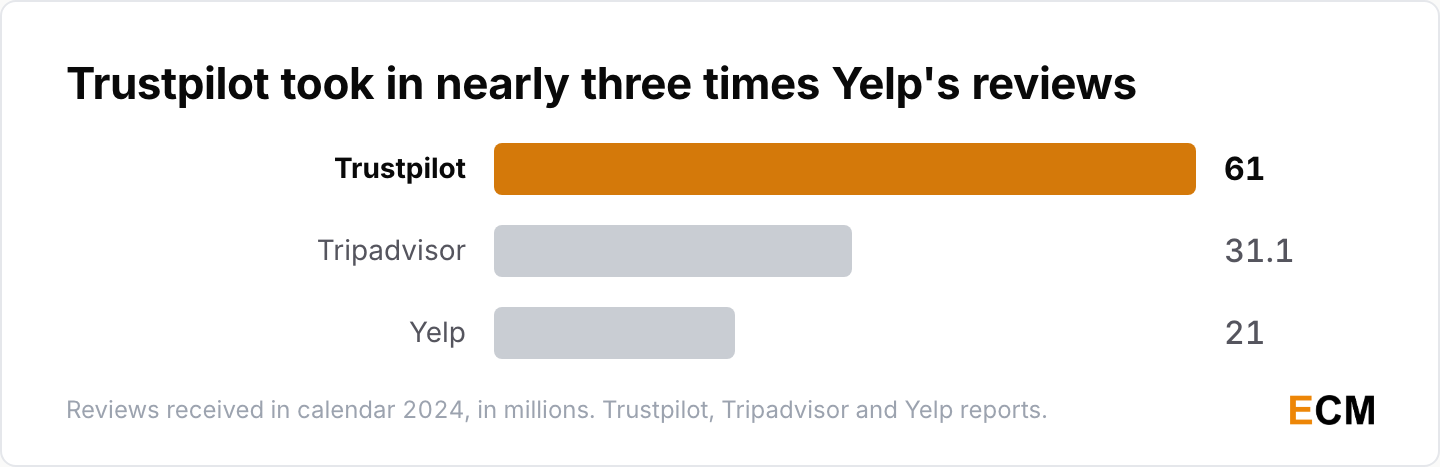
- Trustpilot received 61 million reviews in 2024, nearly three times Yelp’s intake, and carries more than 300 million in total (Trustpilot Trust Report 2025, May 2025).
- Tripadvisor received 31.1 million reviews in 2024 alongside 38.1 million photos and videos, part of nearly 80 million contributions (Tripadvisor 2025 Transparency Report, March 2025).
- Yelp received 21 million reviews in 2024, taking its cumulative total to 308 million, up 7% year over year (Yelp Q4 2024 8-K, February 2025).
- Google Maps published more than 1 billion helpful reviews during 2025, and its community suggested 80 million updates to business hours and contact information (Google, April 2026).
- Yelp’s 2024 net revenue reached a record $1.41 billion, up 6%, with services advertising revenue at $879 million, up 11% (Yelp Q4 2024 8-K, filed with the SEC in February 2025).
- The older Trustpilot line of 2.7 million fake reviews removed and 167.5 million organic reviews written since 2007 has been overtaken by the platform’s current disclosures (Trustpilot Trust Report 2025, May 2025).
Yelp’s number is the only review-volume figure on this page carrying securities-law liability behind it. Worth remembering when you weigh it against a marketing blog post.
Star Ratings Versus Written Reviews
Most Google reviews are too short to persuade anyone of anything.
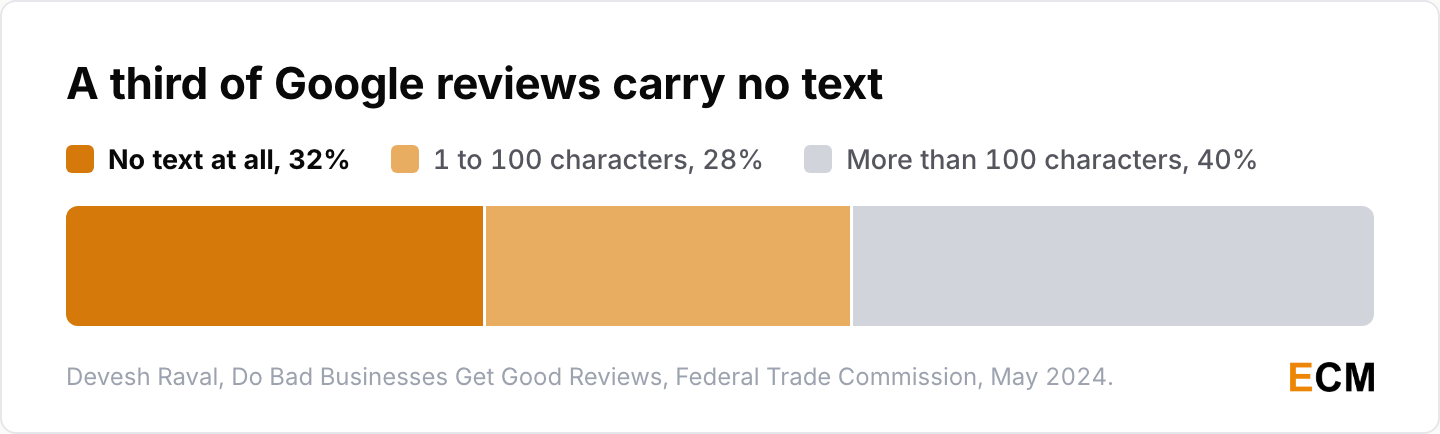
- 32% of Google reviews carry no text at all and another 28% run to 100 characters or fewer, leaving just 40% that run longer than that, so 60% of them give a reader almost nothing to go on (Devesh Raval, Do Bad Businesses Get Good Reviews?, May 2024).
- The average recommended Yelp review ran about 447 characters as of December 31, 2024 (Yelp and YouGov, February 2025).
Yelp commissioned the star-versus-text findings to differentiate itself from Google’s looser standard, so read them as advocacy. The review-length split is not Yelp’s; it comes from an FTC economist’s own working paper.
That paper runs the same measurement on a second dataset and gets 22% with no text and 23% at one to 100 characters. Treat 60% as the high end of a range, not a fixed share.
How Online Reviews Influence Sales and Conversion
This is the section marketers care about most, and it is where the oldest numbers still circulate as though they were measured last quarter.
Conversion Lift From Displaying Reviews
One 2017 study still carries the entire commercial argument for review widgets.
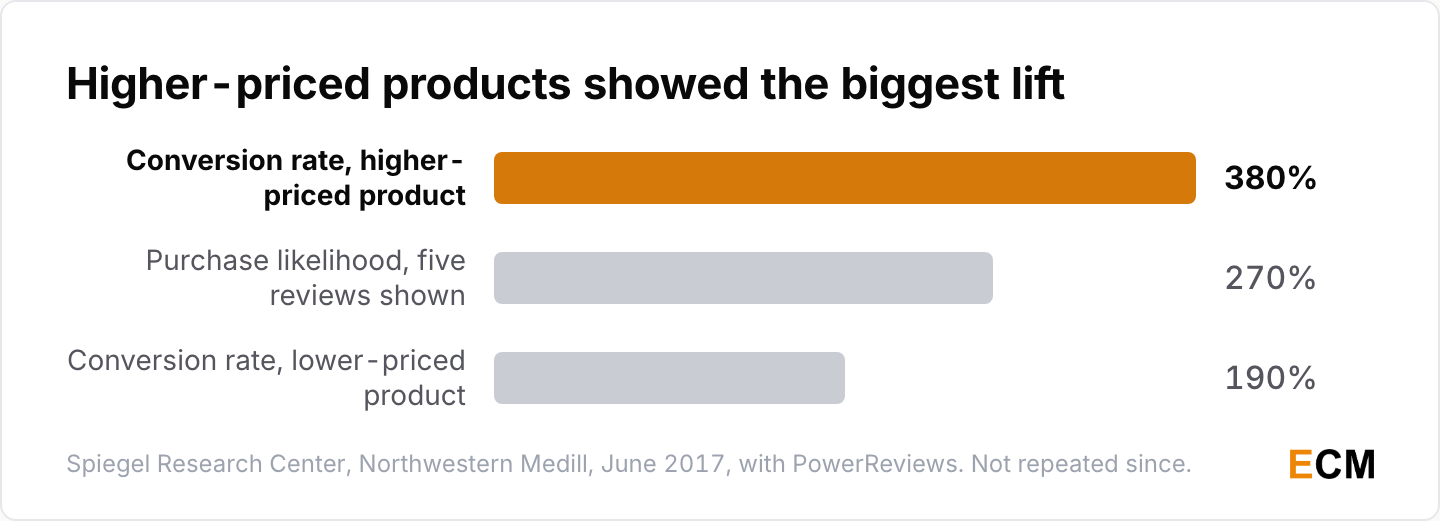
- Showing five reviews raised purchase likelihood 270% against a page with none, and displaying reviews raised the conversion rate 380% for a higher-priced product and 190% for a lower-priced one (Spiegel Research Center, June 2017).
- Purchase likelihood peaks in the 4.0 to 4.7 star range rather than at a perfect 5.0, the too-good-to-be-true effect (Spiegel Research Center, June 2017).
The version circulating in most roundups says the peak is 4.2 to 4.5. Spiegel’s own page states 4.0 to 4.7. The narrower range comes from the companion academic paper rather than the report everyone links to.
No equivalent to the Spiegel work has been published since 2017. That is nine years, across which product pages, review widgets and shopper expectations all changed substantially. The numbers are real. Presenting them as current is a credibility risk you do not need to take.
Star Ratings and Restaurant Revenue
The cleanest causal study in this literature is also the narrowest.
- A one-star increase in Yelp rating drove a 5% to 9% revenue increase for restaurants, and the effect came entirely from independents, with chains showing no significant response (Michael Luca, Harvard Business School Working Paper 12-016, revised March 2016, using Seattle restaurant data from 2003 to 2009).
Luca’s limits are severe: restaurants only, Seattle only, data ending in 2009. It gets quoted as “reviews drive 5 to 9% revenue” across every industry, which the paper does not support. Quote the window with the number.
Review Influence by Industry
Review-influenced spending is concentrated in a few categories, and the only government estimate of it is a decade old.
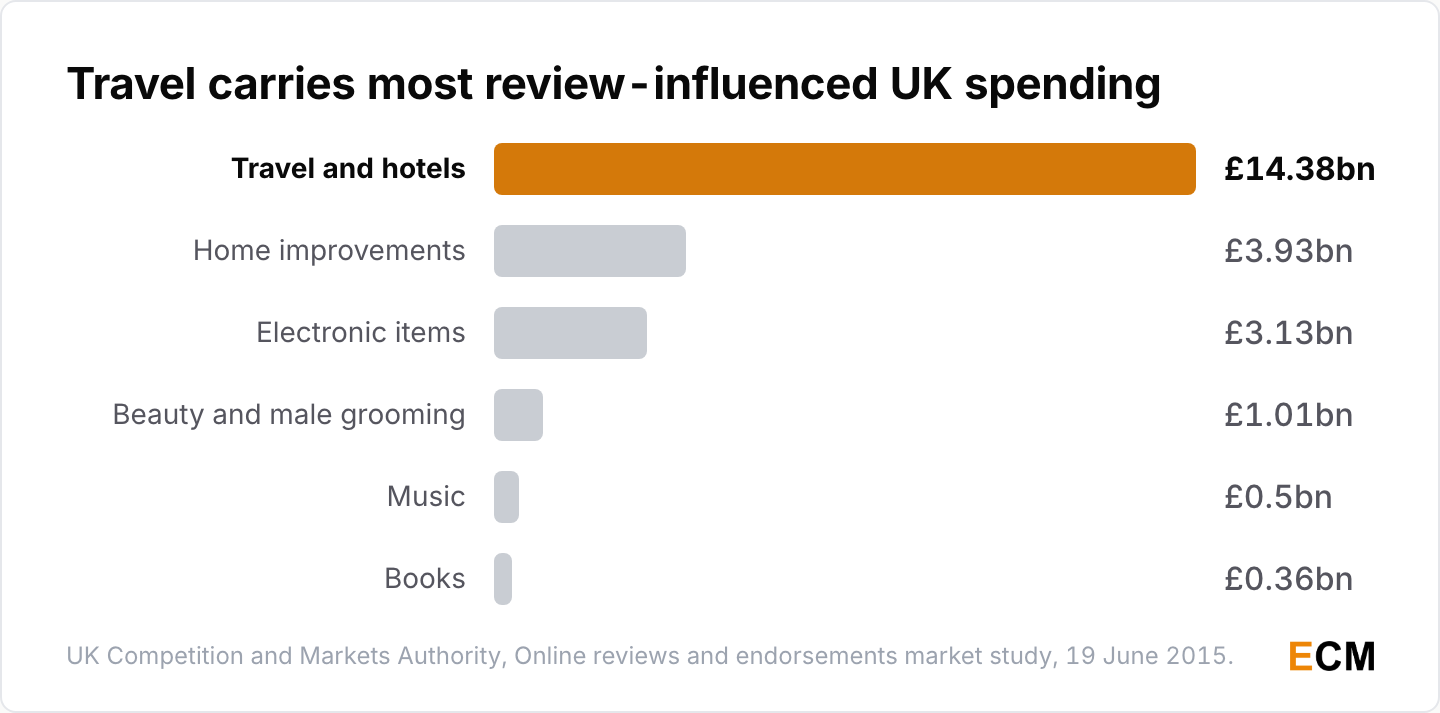
- The CMA estimated £23.31bn of annual UK consumer spending is potentially influenced by online reviews, with travel and hotels carrying £14.38bn of it (UK Competition and Markets Authority, Online reviews and endorsements market study, 19 June 2015).
- The rest splits across home improvements at £3.93bn, electronic items at £3.13bn, beauty and male grooming at £1.01bn, music at £0.5bn and books at £0.36bn (UK Competition and Markets Authority, 19 June 2015).
Travel alone carries £14.38bn of that £23.31bn, which is why Tripadvisor’s moderation numbers matter more to the travel sector than Google’s do. The £23 billion figure is the CMA’s, but it belongs to a 2015 market study rather than the 2025 fake-reviews guidance it usually gets attributed to.
Employment is the gap. Glassdoor publishes no current figure for how many job seekers read company reviews before applying, and Recruit Holdings does not break the metric out in its filings, so there is nothing datable to quote.
Negative Reviews and Brand Perception
Shoppers go looking for the bad reviews on purpose, and a branch’s ratings travel up to the parent brand.
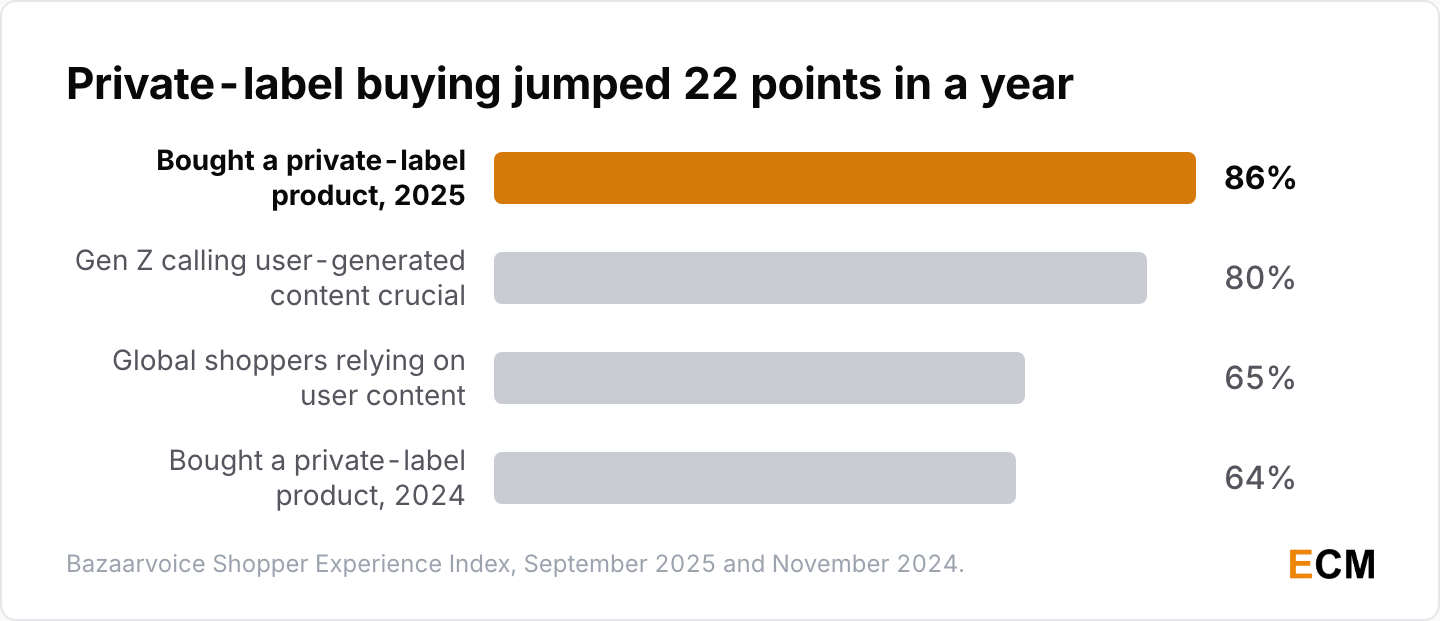
- 86% of global consumers bought a private-label product in the last six months, up from 64% in 2024 (Bazaarvoice Shopper Experience Index 2025, September 2025), while 65% of global shoppers rely on user-generated content in buying decisions, rising to 80% among Gen Z (Shopper Experience Index Vol. 18, November 2024).
- 91% of consumers say a local branch’s reviews shape their perception of the parent brand (BrightLocal 2024, March 2024, n=1,141 US consumers).
- Two long-quoted figures on negative reviews, 85% of shoppers seeking them out before buying and 60% of respondents calling them important, come from older PowerReviews and Bazaarvoice waves; neither figure appears in what either company publishes now, whose current research covers visual content (PowerReviews, February 2024) and omnichannel behaviour (Bazaarvoice, November 2024).
The private-label jump is the quiet one. A 22-point rise in a single year suggests reviews now do work that brand familiarity used to do. If an unknown label with 400 good reviews beats a known brand with 40, your review corpus is your moat. Related reading on the same shift: content marketing statistics and influencer marketing statistics.
Fake Review Statistics and AI-Generated Reviews
Platforms report aggressive removal numbers, regulators have caught up, and researchers doubt anyone can spot a fake at the text level.
Fake Reviews Removed by Platform
Every removal figure below measures what detection caught, never what exists.
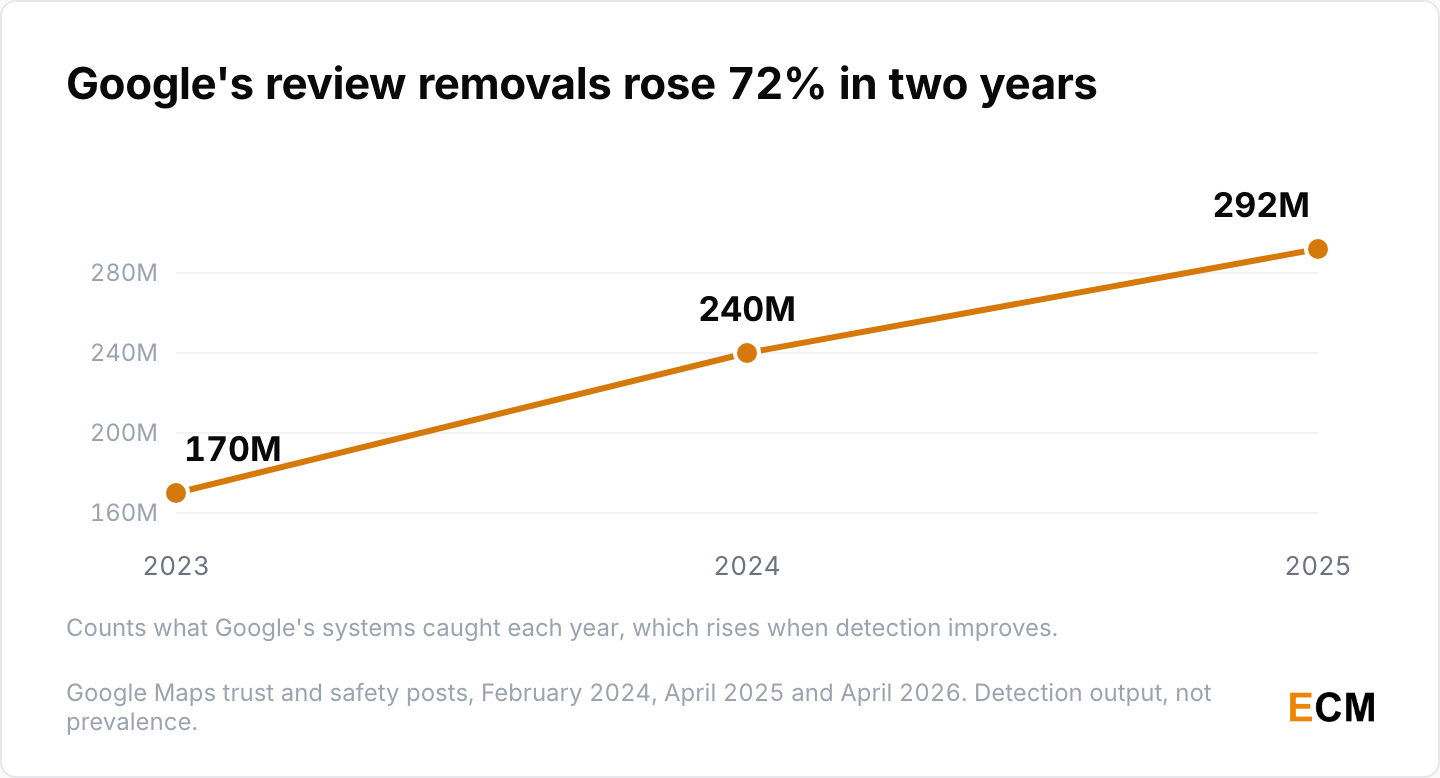
- Google blocked or removed more than 292 million policy-violating reviews in 2025, up from 240 million in 2024 and more than 170 million in 2023 (Google, April 2026; Google, April 2025; Google, February 2024). It also blocked 79 million unverified business-profile edits and removed more than 13 million fake Business Profiles.
- Yelp filtered out nearly 500,000 suspected AI-generated reviews in 2025 and closed more than 1.3 million user accounts, a 138% increase driven mostly by an airline phone-support scam wave (Yelp 2025 Trust & Safety Report, February 2026).
- Yelp also made more than 1,020 reports to Instagram, Facebook, X, Reddit and TikTok about review-trade groups, and 60% of those reports led to action (Yelp 2025 Trust & Safety Report, February 2026).
- Amazon proactively blocked hundreds of millions of suspected fake reviews and helped shut down more than 100 websites facilitating review fraud (Amazon Trustworthy Shopping Experience Report 2025, April 2026).
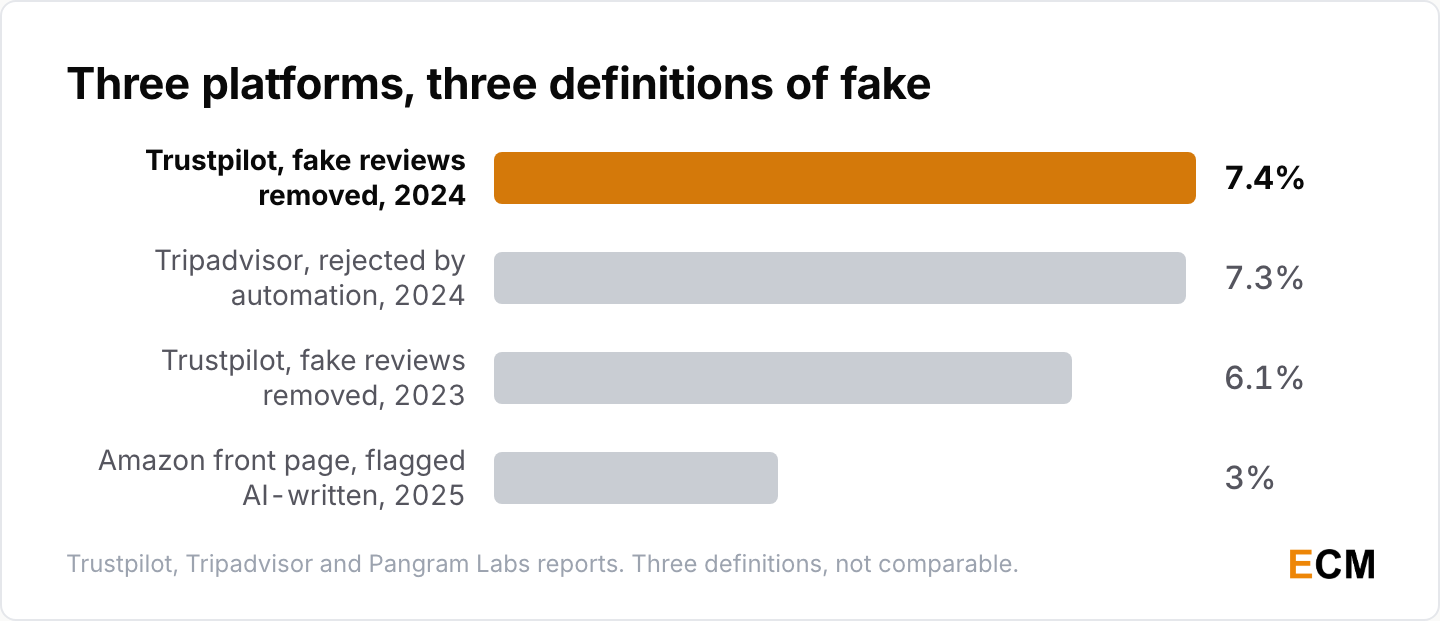
- Trustpilot removed 4.5 million fake reviews in 2024, equal to 7.4% of submissions, up from 6.1% in 2023, and 90% of those removals were caught automatically (Trustpilot Trust Report 2025, May 2025).
- Tripadvisor safeguarded travellers from 2.7 million fraudulent reviews in 2024, of which 54% were review boosting by people affiliated with the business (Tripadvisor 2025 Transparency Report, March 2025).
A platform that improves its classifier reports a higher fake-review rate while the site gets cleaner. A platform that widens its definition reports a jump with no change in behaviour at all. Tripadvisor’s own head of trust and safety said exactly that about her company’s rising numbers.
Amazon’s “hundreds of millions” is a range rather than a figure. Amazon does not break out fake-review removals as a discrete category, so nobody outside the company can size it.
Tripadvisor’s Moderation Funnel in 2024
Almost nine in ten reviews never meet a human.
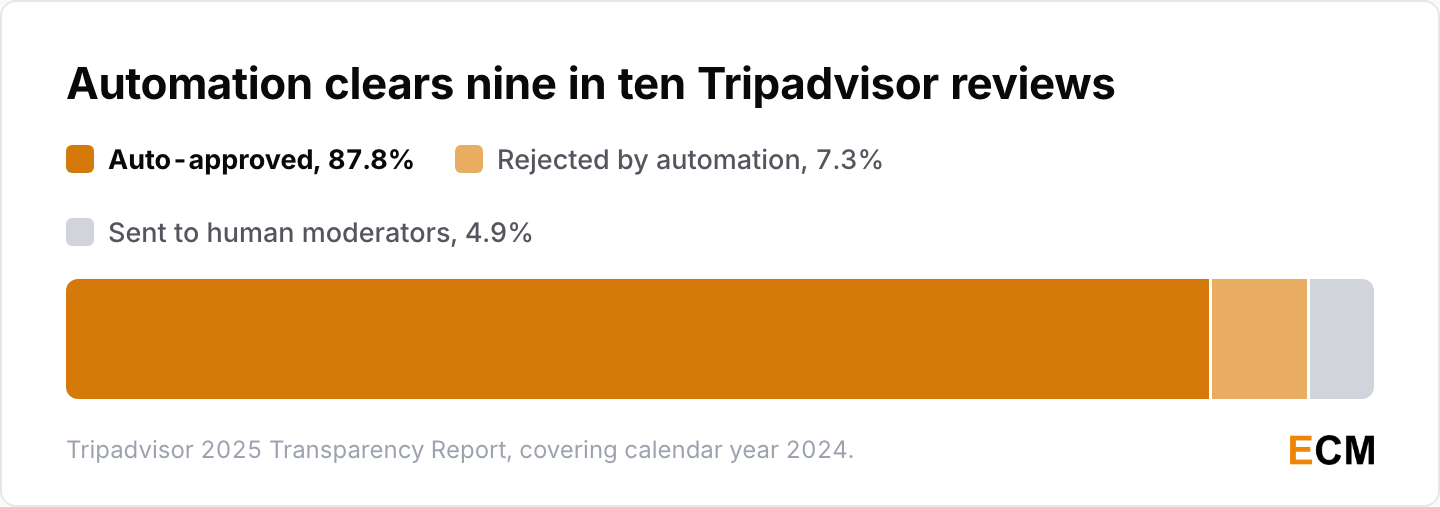
- 87.8% of Tripadvisor submissions met the automation standard for posting in 2024, 7.3% were rejected by technological analysis and 4.9% were routed to human moderators (Tripadvisor 2025 Transparency Report, March 2025).
- Tripadvisor flagged and removed 214,000 AI-generated reviews in 2024, warned around 9,000 businesses over incentivised reviews and removed 360,000 reviews linked to employee incentive programmes (Tripadvisor 2025 Transparency Report, March 2025).
The paid-review industry gets the press coverage. Tripadvisor’s own breakdown says the majority of what it catches is businesses and their staff writing about themselves, which is a much less exotic problem and a much more common one.
AI-Generated Reviews in Independent Research
The detection vendors and the academics disagree, and the disagreement is the finding.
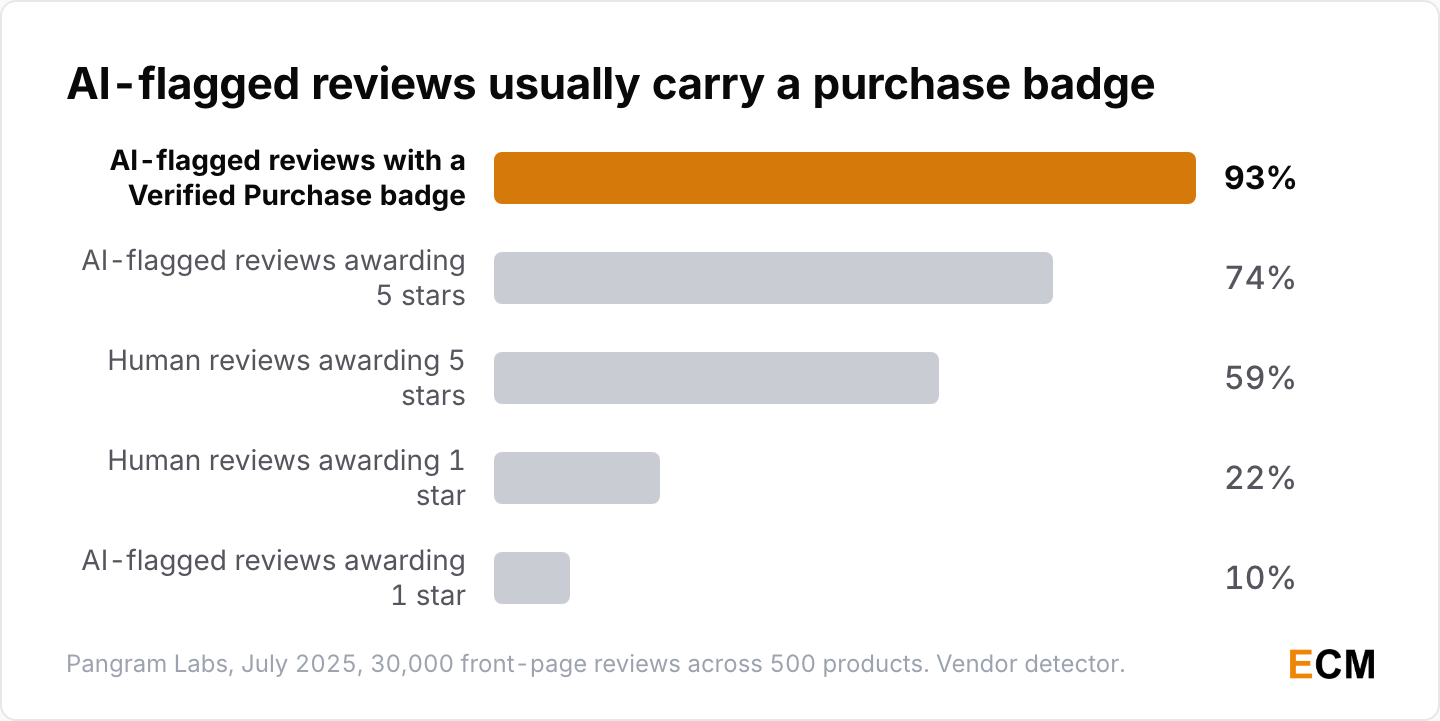
- 3% of front-page Amazon reviews, 909 out of a 30,000-review sample across 500 best-selling products, were flagged as high-confidence AI-generated (Pangram Labs, May 2026).
- 93% of those AI-flagged reviews carried Amazon’s Verified Purchase badge, 74% awarded 5 stars against 59% of human-written reviews, and humans wrote 22% of 1-star reviews against 10% from the AI-flagged group (Pangram Labs, May 2026).
- Human evaluators averaged 50.8% accuracy, which is chance, at telling AI-generated product reviews from real ones, and seven leading language models performed equivalently or worse (Large Language Models as Hidden Persuaders, arXiv preprint, June 2025).
Pangram sells AI-detection software, so read its numbers as an upper bound on what a commercial detector claims to find rather than a measured prevalence. The academic result is the counterweight, and the two cannot both be fully right. My reading is that detectability depends heavily on review length, model and language, and that anyone selling you certainty on this is selling.
The practical signal is the badge. Verified Purchase does not mean human. If your competitive research assumes a purchase badge filters out synthetic text, it does not. For checking copy on your own side of the line, Originality.ai is one option, and the same caveat applies to it: a score is a prompt to look closer, never a verdict. More on that tooling in AI content detection statistics.
Fake Review Laws and Penalties
Both major regimes now treat a fake review as a civil offence with real money attached.
- The FTC’s Trade Regulation Rule on the Use of Consumer Reviews and Testimonials, 16 CFR Part 465, took effect on October 21, 2024 after a 5 to 0 Commission vote, and bans fake or AI-generated reviews, buying positive or negative reviews, undisclosed insider reviews, company-controlled review sites posing as independent, review suppression through legal threats and fake social-media indicators (Federal Register, published August 22, 2024).
- Civil penalties run up to $51,744 per violation as promulgated, inflation-adjusted to $53,088 in January 2025 and held at that level for 2026 (Federal Register, January 17, 2025; Federal Register, September 15, 2026).
- The UK’s unfair trading provisions came into force on April 6, 2025, and a CMA penalty is capped at £300,000 or, if higher, 10% of the respondent’s turnover including turnover outside the UK (Commencement No. 2 Regulations 2025; Digital Markets, Competition and Consumers Act 2024, section 182).
- The FTC’s December 2024 final order against Rytr LLC, which barred the company from selling AI services dedicated to generating consumer reviews for 20 years, was reopened and set aside on December 22, 2025, with ten warning letters for Consumer Review Rule violations issued the same day (FTC, December 2025).
- Roomster’s owners bought more than 20,000 fake four and five star reviews using more than 2,500 fake iTunes accounts, and the FTC and six state attorneys general secured a permanent ban plus a $1.6 million payment (FTC complaint; Illinois Attorney General, August 2023).
The Rytr reversal is narrower than it looks. The FTC withdrew the theory that selling a general-purpose AI writing tool is itself a violation. It did not withdraw from enforcing against fake reviews, which is what the ten concurrent warning letters were for.
Review Responses and Reputation Management Statistics
What you do with a review shapes the next purchase decision, and this section holds the strangest finding on the page.
Review Response Expectations and Timing
Not replying is the cheapest way to halve the number of people willing to use you.
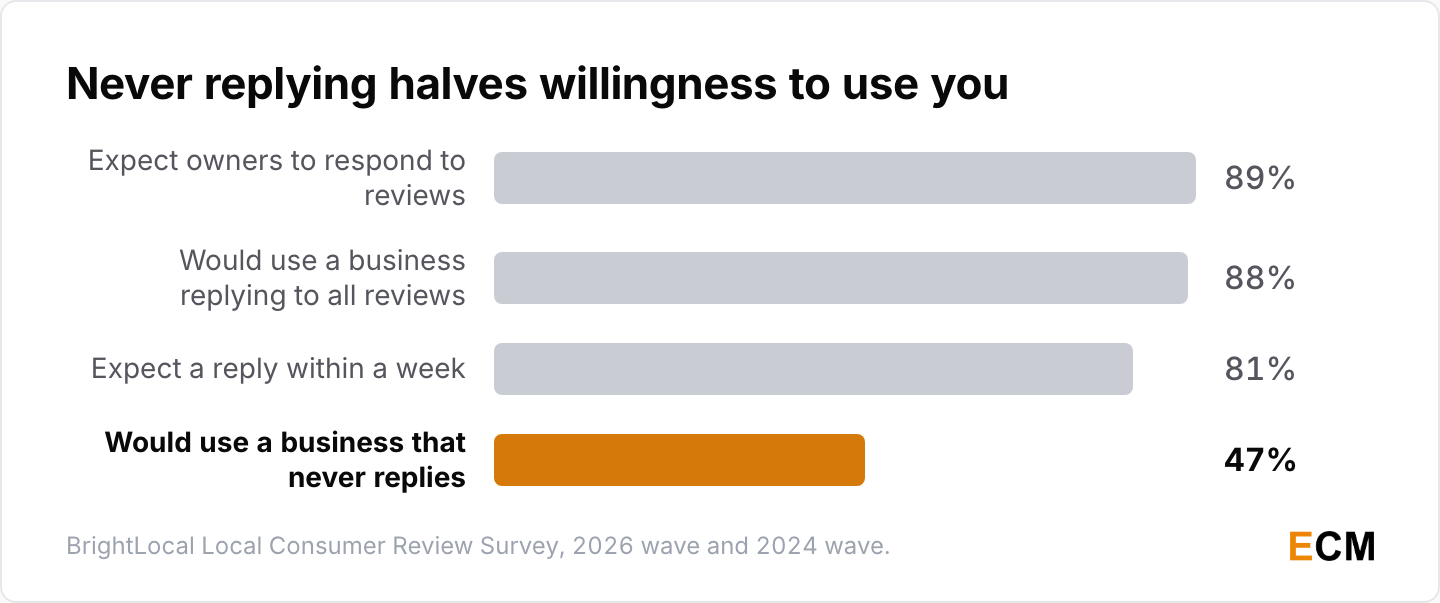
- 89% of consumers expect business owners to respond to reviews and 81% expect that response within a week (BrightLocal, February 2026); 88% say they would use a business that replies to all reviews, against 47% for businesses that never respond (BrightLocal 2024, March 2024).
Put the second one in front of a client who thinks responses are optional. Not responding roughly halves the share of consumers willing to use the business, which is a bigger swing than most of the conversion-rate work on this page, from a much cheaper intervention.
AI-Written Review Responses
The most useful finding here is one that contradicts what people say about AI in every stated-preference survey.
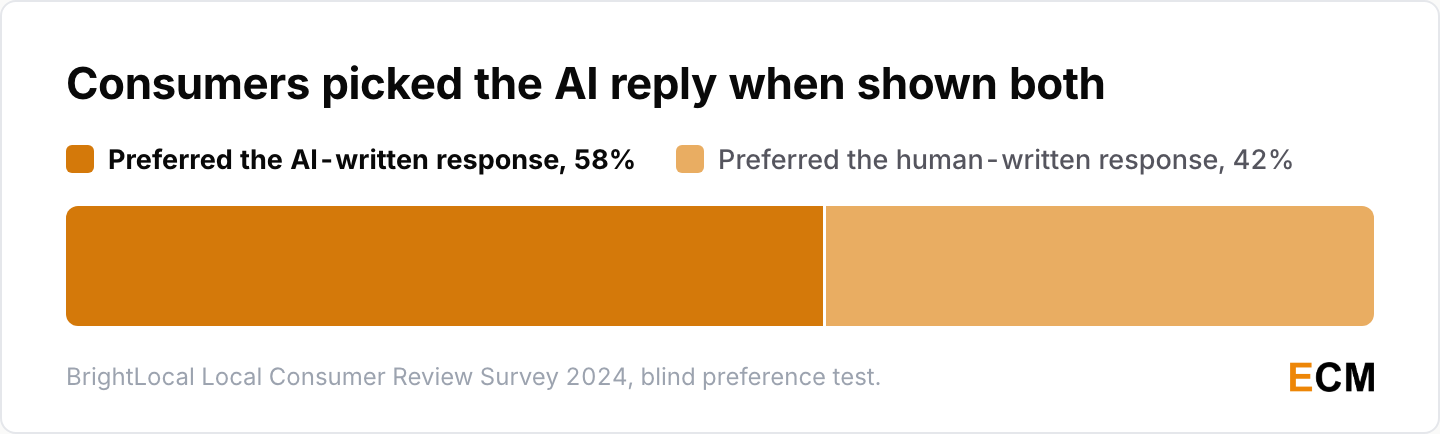
- In a blind test, 58% of consumers preferred the AI-written review response over the human-written one (BrightLocal 2024, March 2024).
- 82% of consumers read AI-generated review summaries and 23% are willing to decide on the summary alone (BrightLocal, February 2026).
I read the blind test as a craft signal rather than permission to automate. The AI response won because it was structured, specific and complete, not because it was AI. A human writing with the same discipline wins the same test. What it rules out is the fear that a well-written AI-assisted response gets spotted and punished, because in a controlled test it was not.
The summaries number is the one to plan against. If almost a quarter of readers will decide on a generated summary without opening a single review, the job is making sure your review corpus says the right thing in aggregate. More on how that intersects with search in SEO statistics and digital marketing statistics.
Frequently Asked Questions
What Percentage of Consumers Read Online Reviews in 2026?
97% of US consumers read reviews when browsing for local businesses, and 41% say they always do, up from 29% in 2025 (BrightLocal Local Consumer Review Survey 2026, February 2026). Cross-platform checking is also common: 74% look at at least two review sites before deciding (BrightLocal 2025, January 2025, n=1,026).
Which Review Platform Do Consumers Trust Most?
By usage Google leads, though its share of review readers fell from 83% in 2025 to 71% in 2026 while Apple Maps nearly doubled from 14% to 27% (BrightLocal, February 2026). By trust signal, 71% of review readers do not count a star rating without text as a review, which favours platforms carrying longer written reviews (Yelp and YouGov, February 2025).
How Much Does a One-Star Rating Change Move Revenue?
The cleanest causal estimate found that a one-star increase in Yelp rating drove a 5% to 9% revenue increase for Seattle restaurants between 2003 and 2009, entirely among independents (Michael Luca, Harvard Business School Working Paper 12-016, revised March 2016). No equivalent updated study exists, so state the window whenever you use it.
Do Negative Reviews Hurt or Help Sales?
Both, and the balance favours keeping them. Purchase likelihood peaks in the 4.0 to 4.7 star range rather than at a perfect 5.0 (Spiegel Research Center, June 2017). Shoppers also go looking for the bad ones on purpose, which is why 91% say they are more likely to buy when reviews carry photos or video showing the product as it really is (PowerReviews, February 2024). A flawless rating reads as suppressed, and review suppression through legal threats is now banned outright (Federal Register, August 2024).
How Do Review Statistics Differ by Industry?
Travel dominates. The CMA put £14.38bn of the £23.31bn in review-influenced UK spending in travel and hotels, against £3.93bn in home improvements and £3.13bn in electronic items (UK Competition and Markets Authority, 19 June 2015). In hospitality, a one-star Yelp rise moved restaurant revenue 5% to 9% (Michael Luca, 2016).
How Do You Get More Customers to Leave Reviews?
Ask everyone and pay nobody. Trustpilot saw 22 million people write their first review in 2024, up 13%, mostly through plain post-purchase invitations (Trustpilot Trust Report 2025, May 2025). Incentives are the trap: Tripadvisor removed 360,000 reviews tied to employee incentive programmes and warned 9,000 businesses (Tripadvisor, March 2025), and undisclosed incentivised reviews now breach 16 CFR Part 465 (Federal Register, August 2024).
Are AI-Generated Reviews a Real Problem?
Yes, though the size depends entirely on who is counting. Pangram Labs flagged 3% of front-page Amazon reviews as high-confidence AI-generated from a 30,000-review sample (Pangram Labs, May 2026). Tripadvisor removed 214,000 AI-generated reviews in 2024 (Tripadvisor, March 2025). Academic work found humans averaging 50.8% accuracy at spotting them (arXiv, June 2025), so vendor detection numbers read as upper bounds.
Is It Illegal to Buy Fake Reviews?
In the US, yes, since October 21, 2024, when the FTC’s Consumer Reviews Rule took effect, with civil penalties up to $53,088 per violation (Federal Register, January 2025). In the UK the unfair trading provisions came into force on April 6, 2025 (Commencement No. 2 Regulations 2025), with penalties capped at £300,000 or 10% of turnover, whichever is higher (DMCC Act 2024, section 182).
How Much Consumer Spending Do Online Reviews Influence?
The UK Competition and Markets Authority put it at £23.31bn of annual UK consumer spending, with travel and hotels accounting for £14.38bn. Note the date: it comes from the CMA’s Online reviews and endorsements market study published on 19 June 2015 (UK Competition and Markets Authority), not from its 2025 fake-reviews guidance, where the figure is often wrongly attributed. No equivalent US government estimate exists.
Should I Respond to Reviews With AI?
The evidence says a well-written AI-assisted response will not be detected or punished. In a 2024 blind test, 58% of consumers preferred the AI-written response over the human-written one, while the same consumers said in stated-preference questions that AI equals fake (BrightLocal 2024, March 2024). The response won on structure and specificity, which a human can match. Treat AI as a drafting aid on a response you would have been willing to write yourself.
Written by
Editorial Staff
The Editorial Staff represents the writers, editors, and content creators who have worked (or work) at Elite Content Marketer. The experimenter-in-chief behind the team is Chintan Zalani, who has close to a decade of experience trying to make sense of the content marketing industry. Started in 2019, Elite Content Marketer is on a mission to help creators build sustainable businesses.
Related Articles

Marketing Data
58 AI Personalization Statistics for 2026: ROI + Adoption
58 AI personalization statistics for 2026: 78% of marketers can’t make enough personalized content, and 87% of brands rate it good while 29% of consumers agree.
Oct 2, 2026Read more →
Marketing Data
60 AI Workflow Automation Statistics for 2026
60 AI workflow automation statistics for 2026: 37% of respondents see any EBIT impact from AI, 6% are high performers, and agents scale at big firms.
Oct 1, 2026Read more →
Marketing Data
AI Image Generation Statistics 2026: 60 Data Points
60 AI image generation statistics for 2026: people now create more than 3 billion images a week with ChatGPT Images and OpenAI’s API.
Sep 30, 2026Read more →