In fall 2024, 26.5% of all US postsecondary students took every one of their courses at a distance (NCES, Digest of Education Statistics 2025). The online learning statistics below show why completion figures disagree so wildly, and how fast AI is rewriting who pays for study help.
Online Learning Statistics 2026: 53 Growth Data Points
 Written by Editorial Staff
Key Takeaways

- Online is most of US higher education now. 54.7% of students took at least one course at a distance in fall 2024 and 26.5% took every one that way (NCES, Table 311.15).
- The famous completion numbers describe different people. Certification runs from 3.13% of everyone registered on edX to 56% among learners who paid (Reich and Ruiperez-Valiente, Science, 2019).
- The 15% MOOC benchmark is a 2015 number. The aggregated dataset behind it puts average completion near 15%, approaching 40% in the best courses (Katy Jordan, 2015).
- Platform scale is an account count, not an audience. 205 million people had registered on Coursera by 31 March 2026, and the company publishes no active-user figure (Coursera Q1 2026 results).
- AI has already taken a business apart. Chegg’s academic services revenue fell 61% year over year in the quarter to June 2026 (Chegg Form 10-Q).
- Student use has outrun campus policy. 84% of US high schoolers used generative AI for schoolwork by May 2025 (College Board) and 64% of US teens use an AI chatbot (Pew Research Center, 2025), while 28% of institutions had a formal policy (Tyton Partners, 2025).
- No agency publishes an e-learning market size. The most defensible figure covers all education and training spending, almost $10 trillion by 2030 at 4.4% a year (HolonIQ, 2025).
Online Education Statistics: How Many People Learn Online
US Distance Learning Statistics and Enrollment
One federal table carries every credible US distance learning number, and it moved again in fall 2024.

- Of 19,659,633 students enrolled in US degree-granting postsecondary institutions in fall 2024, 26.5% took every course at a distance, 28.2% took some and 45.3% took none (National Center for Education Statistics, Table 311.15).
- 10,761,754 students, 54.7% of the total, took at least one distance education course in fall 2024 (NCES, Table 311.15).
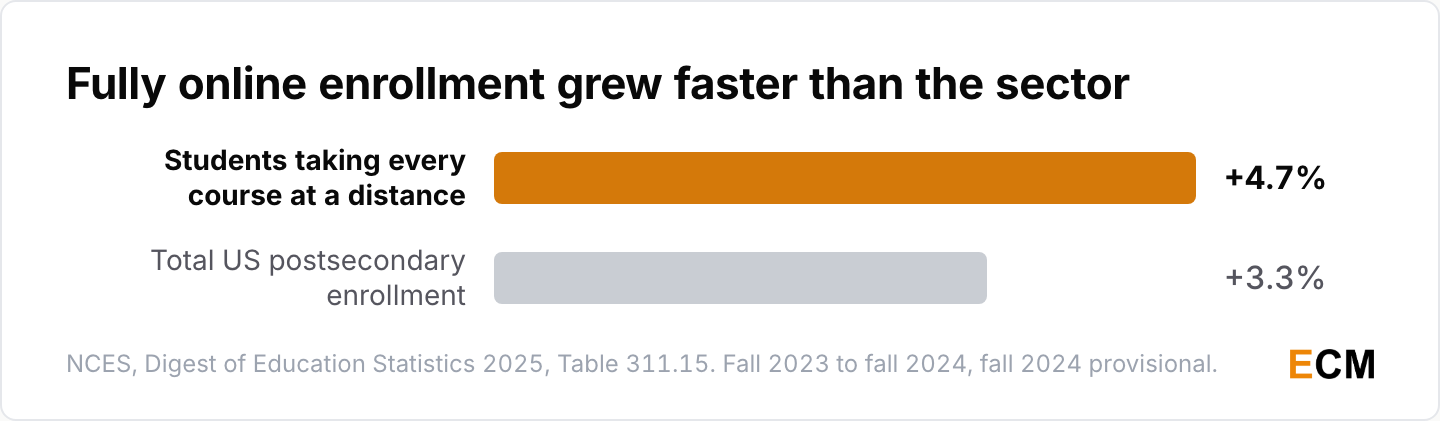
- Fully online enrollment is growing faster than the sector: 4,982,327 studied exclusively at a distance in fall 2023 against 5,214,325 in fall 2024, a rise of 4.7% against 3.3% for total enrollment (NCES, Table 311.15).
- The NCES Fast Facts page on distance learning, which ranks first in Google for this topic, still reports fall 2021 figures, three enrollment cycles behind the Digest table it summarizes (NCES Fast Facts). Cite the table.
Undergraduate Versus Graduate Online Enrollment
Graduate students go fully online far more often than undergraduates, and they rarely mix the two formats.
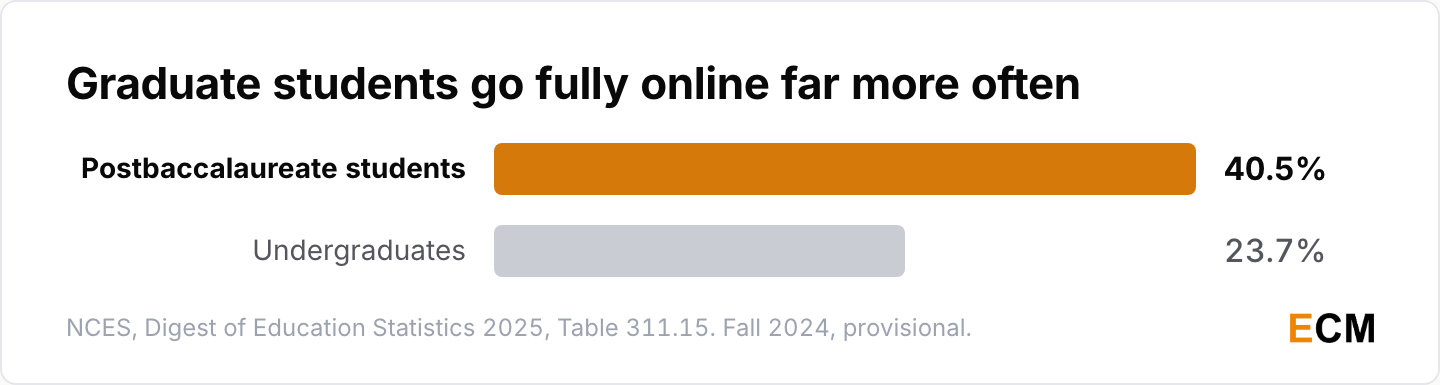
- 16,385,717 US undergraduates were enrolled in fall 2024, of whom 23.7% took every course at a distance and 54.6% took at least one (NCES, Table 311.15).
- Among 3,273,916 postbaccalaureate students in fall 2024, 40.5% took every course at a distance and only 14.8% mixed distance and in-person courses (NCES, Table 311.15).
That split matters if you sell education. Undergraduates blend online classes with campus ones. The graduate learner who goes fully online is usually a working adult buying a credential on a schedule, which is exactly what an online program sells.
Global Online Learning Enrollment and Access
Worldwide the binding constraint isn’t completion, it’s getting into formal education at all.
- 269 million students were enrolled in higher education worldwide, roughly 43% of the 18 to 24 age group and more than double the figure of 20 years earlier (UNESCO, 2024).
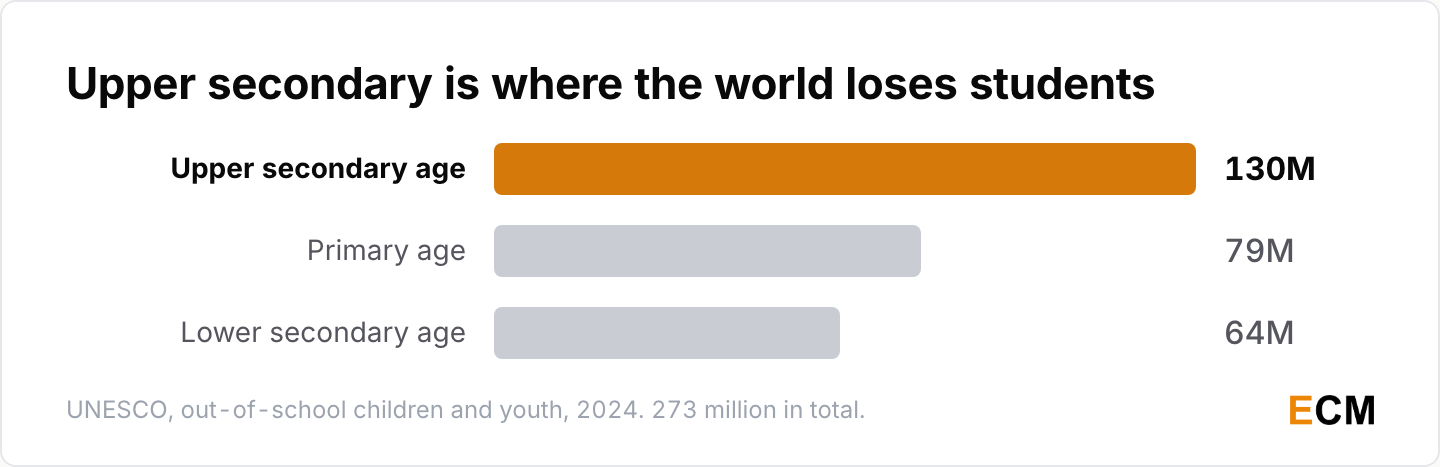
- 273 million children and youth were out of school in 2024: 130 million of upper-secondary age, 79 million of primary age and 64 million of lower-secondary age (UNESCO).
- Out-of-school numbers fell 33% between 2000 and 2015, then rose 3% by 2024, with low-income countries up 29% since 2015 (UNESCO).
Online Course Completion Rate Statistics
Online Course Completion Rates by Cohort
Completion isn’t one number for online learners but six, and the gap between them is entirely about who got counted.
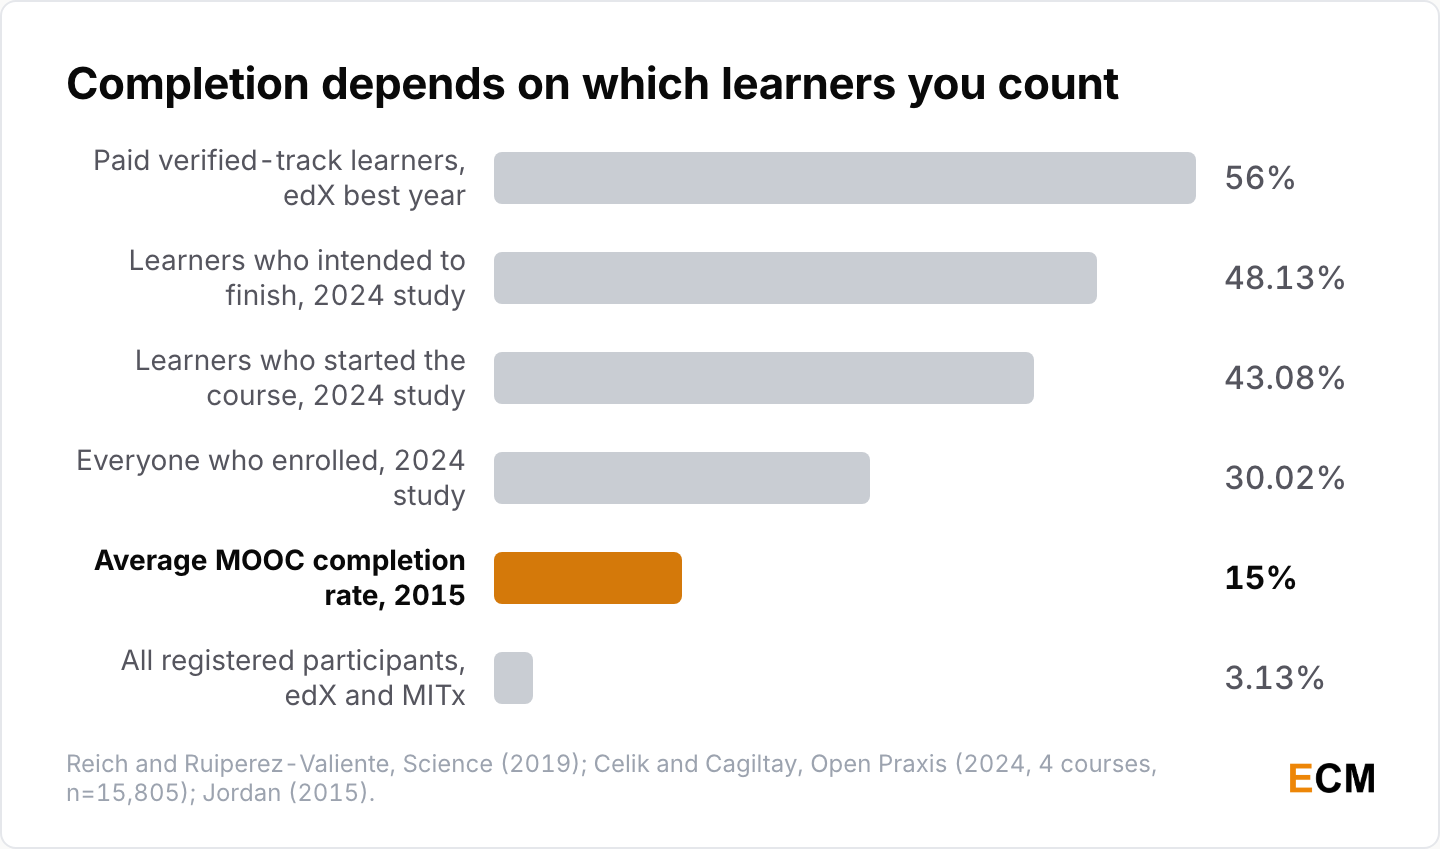
- Certification among all registered edX and MITx participants was 4.96% in 2013-2014, peaked at 5.91% in 2014-2015, then declined in every subsequent year the study covers to 3.13% by 2017-2018 (Reich and Ruiperez-Valiente, “The MOOC Pivot,” Science, 2019).
- Among participants in that study who said they intended to complete, certification ran between 11.5% and 17.7%, and among paid verified-track learners it ran between 44% and 56% (Reich and Ruiperez-Valiente, 2019).
- The most recent peer-reviewed completion study reports 30.02% raw completion across 15,805 enrollees in four MOOCs, rising to 43.08% among learners who started and 48.13% among those who intended to finish (Celik and Cagiltay, Open Praxis, 2024).
- Per-course raw completion in that study ranged from 12.3% to 44.05%, across only four courses (Celik and Cagiltay, 2024).
- The average completion rate across massive open online courses is approximately 15%, and can approach 40% in the best cases (Katy Jordan, MOOC Completion Rates: The Data, data last updated 12 June 2015).
Where the 96% Dropout Figure Comes From
The 96% dropout line is a fair paraphrase of one measure and a poor description of every other one.

- A roughly 96% dropout rate describes the 3% to 6% certification rate among everyone who registered on edX, and does not describe learners who paid, where certification reached 56% (Reich and Ruiperez-Valiente, 2019).
- Registration on a free platform is closer to bookmarking than to enrolling: 52% of registrants never enter the courseware at all (Reich and Ruiperez-Valiente, 2019).
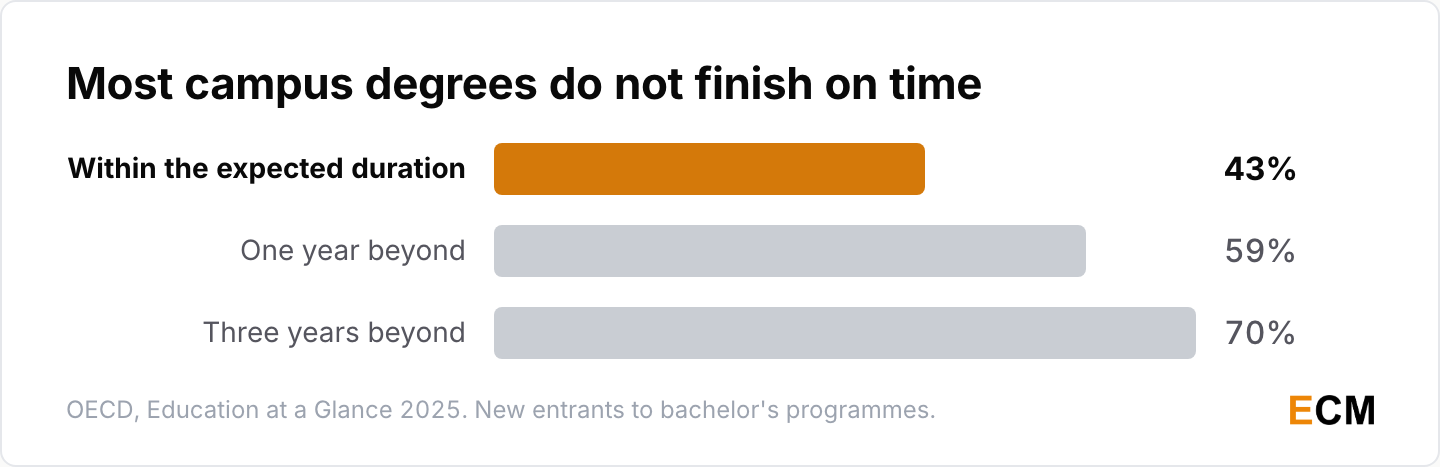
- Campus degrees are not a high bar either: 43% of new entrants to bachelor’s programmes across 32 OECD and partner countries graduate within the expected duration, 59% after one additional year and 70% after three (OECD, Education at a Glance 2025).
What Increases Online Course Completion
Paying is the cheapest available proxy for intent, and in the edX data it separates a 3.13% certification rate from a 56% one.
- A study of more than 70 Coursera courses found a certificate effect worth 8% to 9% additional engagement and a transient sunk-cost effect worth 17% to 20% (Goli, Chintagunta and Sriram, Journal of Marketing Research, 2021).
- Intent matters as much as price: only 35% of participants in one Columbia study planned to earn the alternative credential at all, and a quarter planned to take every course in a series without earning it (Hollands and Kazi, CBCSE, Teachers College, Columbia University, 2018).
- The most-repeated version of that 15% figure traces to one sentence in a 2018 Columbia report, where ten respondents at a September 2018 webinar reported Specialization completion of 15% or less, eight of them 5% or less (Hollands and Kazi, 2018).
If you’re building a course, the practical read is simple. Charge for it, give it a deadline, and stop comparing your numbers to free MOOC benchmarks. I go into which platforms make that easiest in the best online course platforms roundup.
Online Learning Platform Statistics and Users
Coursera and Udemy Are Now One Company
The two biggest course marketplaces merged in May 2026, so treat any comparison between them as history.
- Coursera completed its combination with Udemy on 11 May 2026, leaving former Coursera holders with about 59% of the company and former Udemy holders about 41%, with $115 million of expected annual run-rate savings within 24 months (Coursera).
- The combined company says it connects learning signals from more than 290 million learners and 18,000 enterprise customers (Coursera, 2026).
- Coursera’s revenue for the quarter to March 2026 was $195.7 million, up 9% year over year, and it reaffirmed a full-year outlook of $805 million to $815 million (Coursera Q1 2026 results).
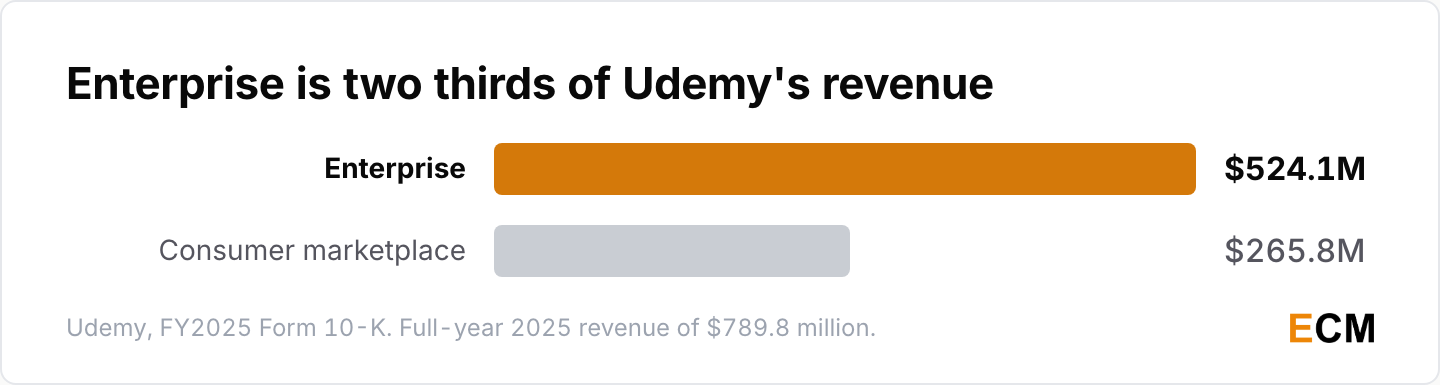
- Udemy’s final year as an independent public company produced $789.8 million of revenue, an increase of just 0.4% on the prior year (Udemy FY2025 Form 10-K).
- Enterprise revenue was $524.1 million, 66% of the total, while consumer marketplace revenue fell 9% to $265.8 million (Udemy FY2025 Form 10-K).
Duolingo User and Revenue Growth
Duolingo is the only large company here reporting daily active users, which tells you how the rest prefer to be measured.
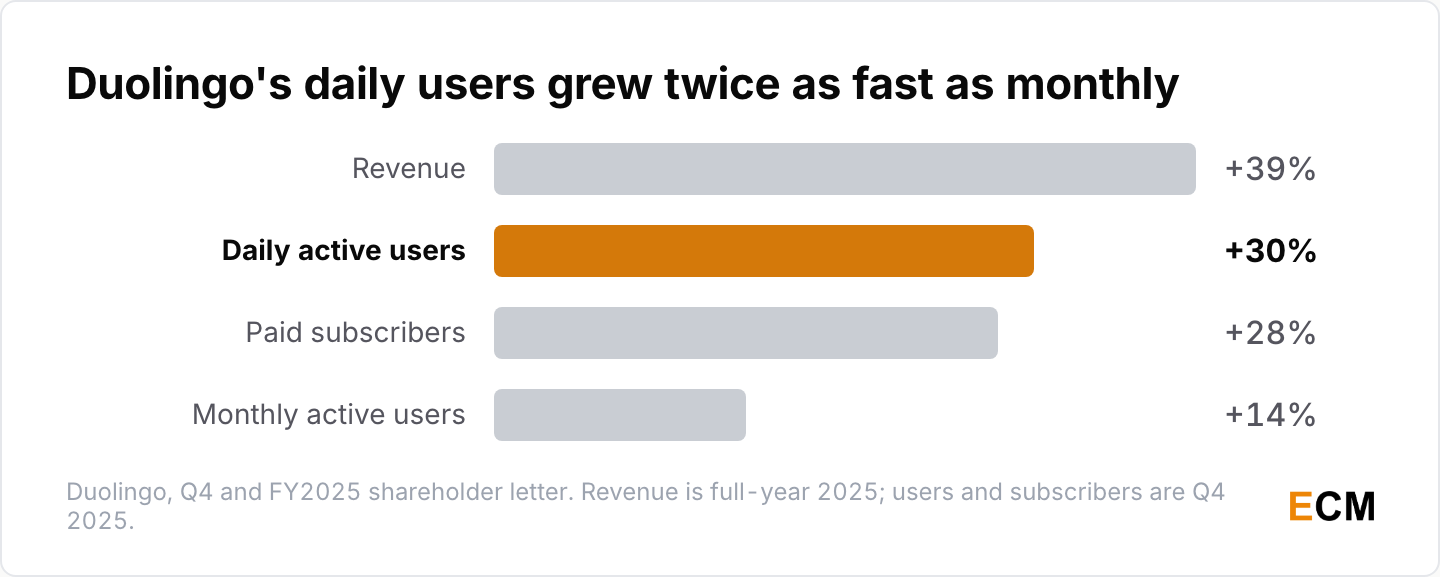
- Duolingo averaged 133.1 million monthly active users in the fourth quarter of 2025, up 14%, with daily active users at 52.7 million, up 30% (Duolingo Q4 and FY2025 shareholder letter).
- Paid subscribers reached 12.2 million at the end of 2025, up 28%, so roughly 9% of monthly actives pay (Duolingo, derived by dividing period-end paid subscribers by averaged monthly active users).
- Full-year 2025 revenue was $1,037.6 million, up 39%, on bookings of $1,158.4 million, with net income of $414.1 million that includes a one-time $256.7 million tax benefit (Duolingo).
Khan Academy and Creator Course Platforms
Platforms publish registered accounts, but active learners are the number that matters and almost nobody reports it.
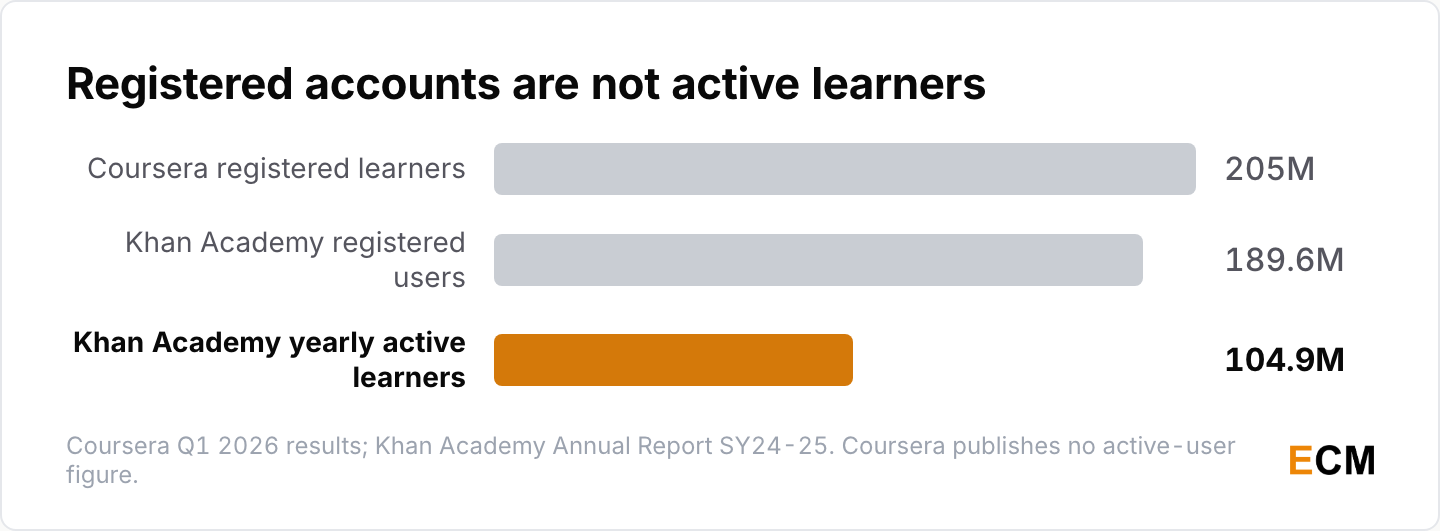
- 205 million people had registered on Coursera as of 31 March 2026, after a first-quarter record of 7.6 million new registrations, and Coursera publishes no monthly or daily active user count (Coursera Q1 2026 results).
- Khan Academy had 189.6 million registered users at the end of the 2024-2025 school year after adding 20.9 million, against 104.9 million yearly active learners (Khan Academy Annual Report SY24-25).
- Learners spent 66.8 billion minutes on Khan Academy during the 2024-2025 school year, up 8.1 billion year over year, and 2.0 million people had access to Khanmigo, its AI tutor (Khan Academy).
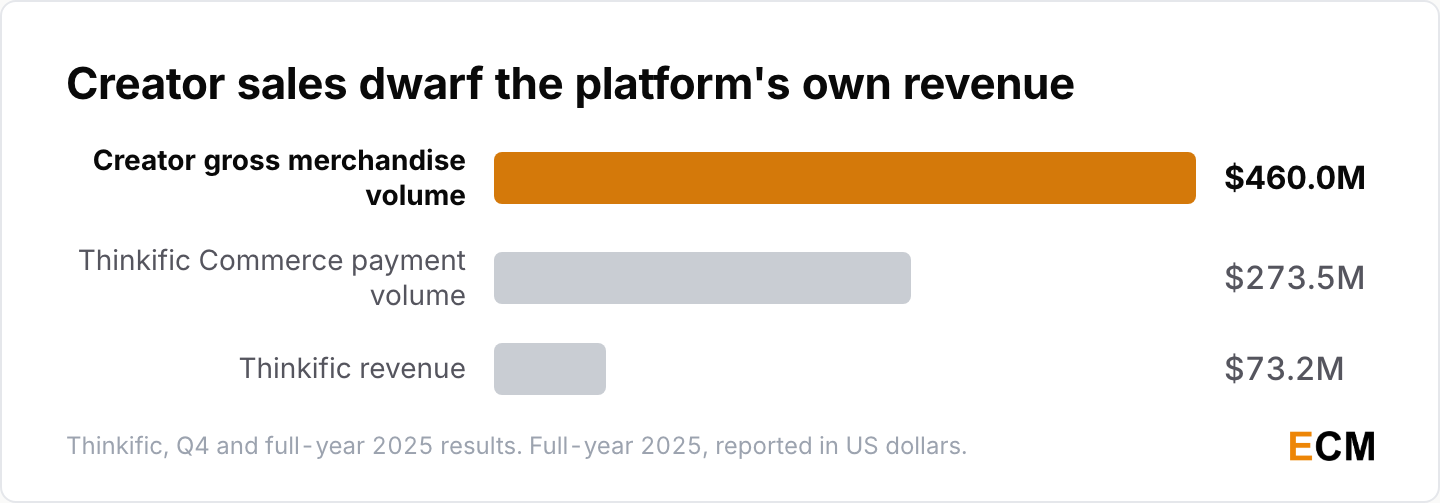
- Thinkific processed $460.0 million of creator gross merchandise volume in 2025, flat year over year, on revenue of $73.2 million, with Thinkific Commerce payment volume up 36% to $273.5 million (Thinkific Q4 and full-year 2025 results).
Thinkific is the only creator course platform of any scale that files public financials, which is why it’s the only one with a number here. Kajabi, Teachable, Podia and Skool are private. The online learning platforms breakdown covers what each is good at, with full reviews of Kajabi and Thinkific.
AI in Online Learning Statistics
How Students and Instructors Use AI
Students and instructors both adopted AI fast, and nobody has measured what it does to learning.

- 84% of US high school students reported using generative AI tools for schoolwork by May 2025, up from 79% in January of the same year, and 69% named ChatGPT specifically (College Board).
- 42% of US college students used generative AI weekly or daily in spring 2025, up from 14% in spring 2023, against 30% of instructors and 40% of administrators (Tyton Partners, Time for Class 2025).
- 64% of US teens aged 13 to 17 use an AI chatbot, and roughly three in ten use one every day (Pew Research Center, 2025).
- Computer science students accounted for 38.6% of student conversations in an analysis of roughly one million anonymized Claude conversations, filtered to 574,740 judged relevant to academic work, despite being 5.4% of US bachelor’s degrees (Anthropic Education Report, 2025).
The Anthropic figures come from the company whose product they measure, on one platform, over a short window. Read them as a description of Claude users, not of students in general.
Institutional AI Policy Adoption
Students moved first, instructors second, and higher education institutions are still writing the rules.
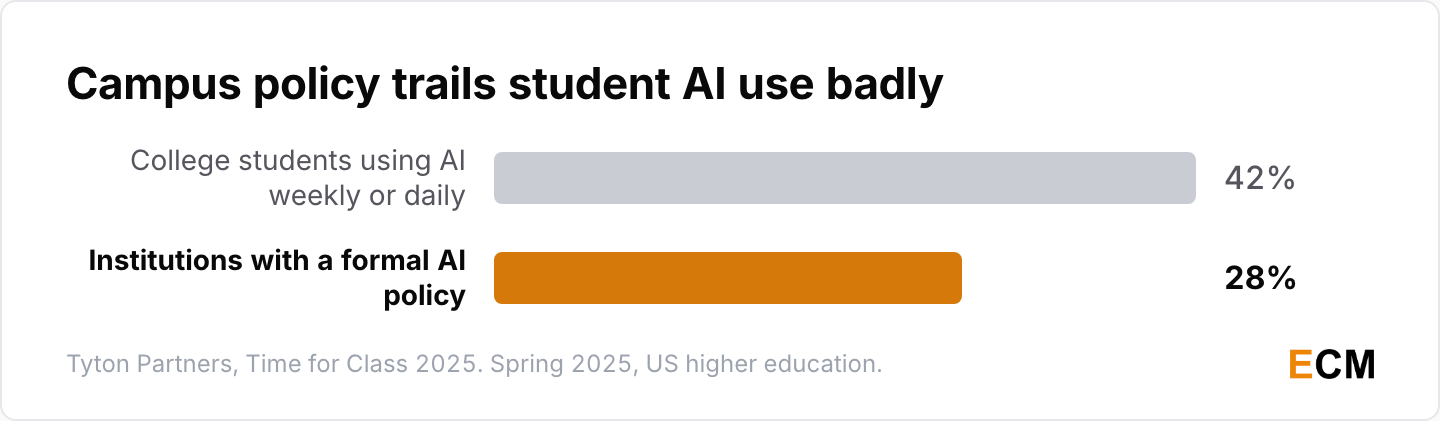
- Only 28% of US institutions had a formal institution-wide generative AI policy developed and rolled out as of spring 2025 (Tyton Partners, Time for Class 2025).
- In the absence of policy, educators built their own use: curriculum development accounted for 57% of educator conversations in an analysis of about 74,000 anonymized Claude conversations from higher-education accounts, with academic research at 13% (Anthropic Education Report, 2025).
AI Impact on Chegg Revenue
Chegg is the clearest case of AI taking a business apart, and the company says so in its own filing.

- Chegg’s total net revenue for the quarter ended 30 June 2026 was $51.8 million against $105.1 million a year earlier, a fall of 51% (Chegg Form 10-Q).
- Academic Services revenue fell 61%, from $87.9 million to $34.3 million, over that same quarter (Chegg Form 10-Q, 2026).
- Chegg Skilling, the part of the business that teaches skills rather than supplying answers, held roughly flat at $17.5 million against $17.2 million in the same two quarters (Chegg Form 10-Q, 2026).
- Over the first six months of 2026, total revenue fell 49% to $115.1 million (Chegg Form 10-Q).
- Chegg names the cause in its filing, writing that students “see generative AI products like ChatGPT and others as strong alternatives to vertically specialized solutions for education”, and it filed an antitrust complaint against Google on 24 February 2025 over AI Overviews (Chegg Form 10-Q).
A business whose value was answering student assignment questions lost half its revenue in a single year. The part that teaches skills rather than supplying answers didn’t move.
Online Learning Market Size and Course Costs
How Big Is the Online Learning Market
No government statistical agency publishes an online education market size, so the e-learning statistics in circulation are all analyst estimates.
- The global education and training market is projected to reach almost $10 trillion by 2030, growing at 4.4% a year, in a 180-page report that counts public school systems and university tuition rather than digital learning alone (HolonIQ, 2025 Global Education Outlook).
- Global EdTech venture funding was $1.8 billion in 2024, the lowest level since 2014, against 300 M&A deals and 4 IPOs in education that year (HolonIQ).
- EdTech has taken roughly 2% of all global venture funding since 2010 (HolonIQ).
Market-size decks keep going up while the money going into new companies keeps going down. Both can be true, and the second is the better guide to what the next two years look like.
Corporate Learning and Reskilling Demand
Employers are the buyer with a real online training budget here, and they keep saying skills are the bottleneck.
- Employers expect 39% of workers’ core skills to change by 2030, down from 44% in the 2023 edition of the same survey (World Economic Forum, Future of Jobs Report 2025).
- 170 million new jobs are projected to be created and 92 million displaced by 2030, a net increase of 78 million and structural churn of 22% of the 1.2 billion formal jobs in the dataset (WEF).
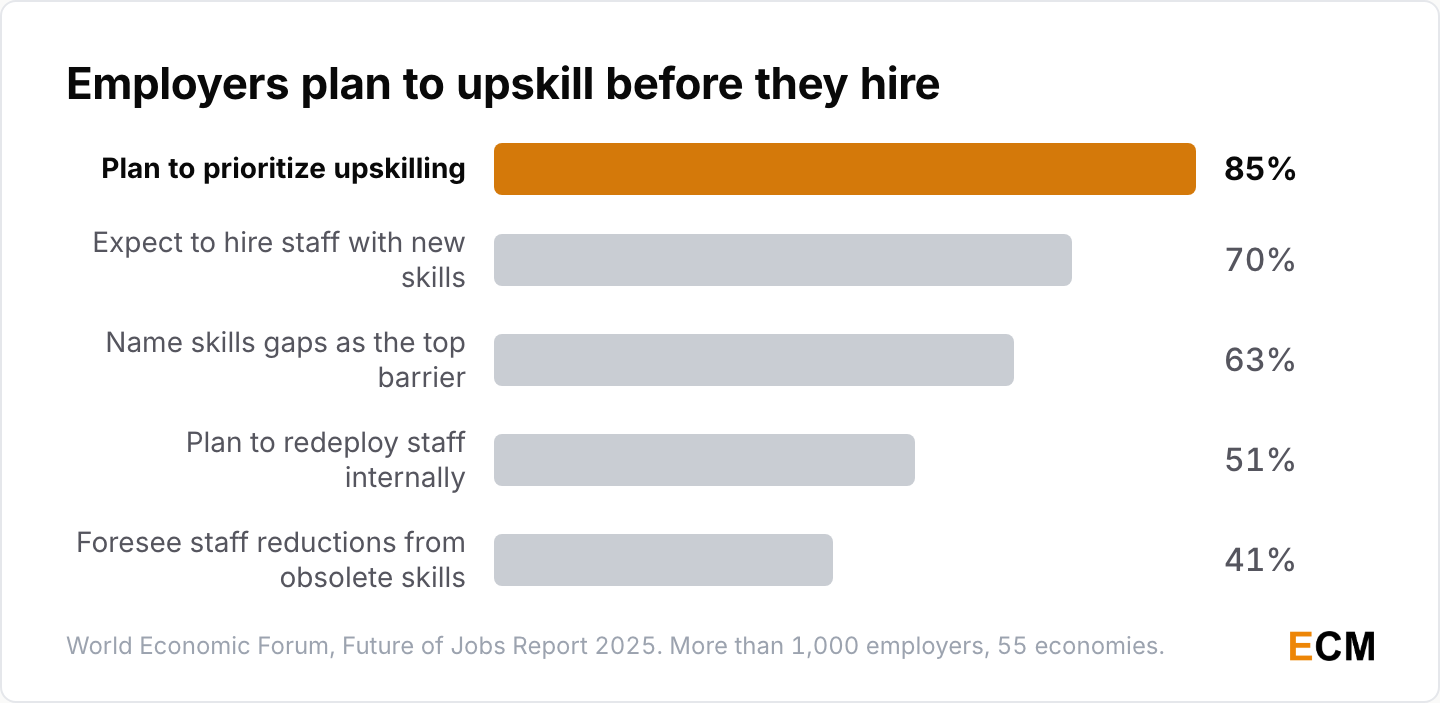
- 63% of employers name skills gaps as the biggest barrier to transformation over 2025 to 2030, 85% plan to prioritize upskilling, 70% expect to hire staff with new skills, 51% plan internal redeployment and 41% foresee staff reductions (WEF).
- Only 36% of organizations qualify as career development champions on LinkedIn’s index and 31% show limited adoption, while 51% of those champions call themselves leading or accelerating on generative AI (LinkedIn Workplace Learning Report 2025).
The WEF survey covers more than 1,000 employers across 55 economies, and these are projections rather than measured outcomes. LinkedIn sells learning software and invented the champion category, so trust its direction and not its precision.
Average Online Course Price and Creator Earnings
One platform publishes a course-pricing dataset in the open while everyone else quotes press releases.
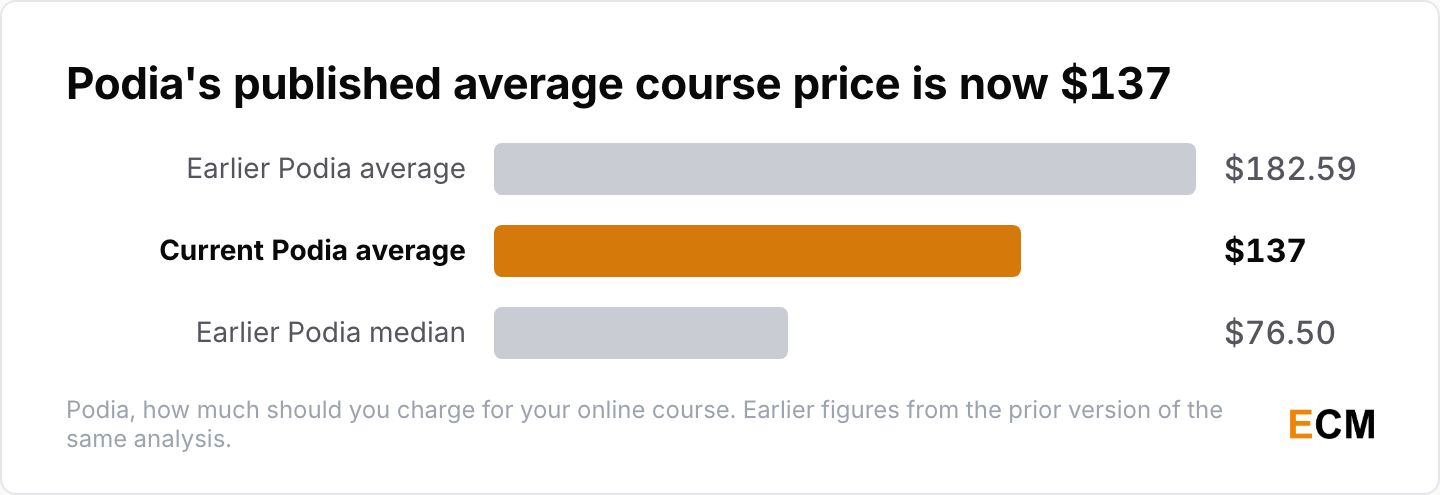
- Across 132,009 course sales on one creator platform, the average course price is $137 (Podia, last updated 5 November 2021).
- When this page was first published it cited an earlier version of the same Podia analysis, reporting an average of $182.59 and a median of $76.50 across roughly 133,000 courses (Podia). Podia has since revised that dataset, so the $137 average above is the current one.
- The average MicroMasters cost $960 in the Columbia study, and one Boston University MicroMasters cost $900 for five courses of six to eight weeks (Hollands and Kazi, 2018).
Kajabi, Teachable, Podia and Skool publish no audited figures, so every creator earnings number attributed to them traces to a press release or a third-party estimate. More on building the audience that makes commodity pricing unnecessary in the creator economy statistics page.
For the tools side, see the best online course platforms roundup. Related reading: content marketing statistics.
Frequently Asked Questions
What Is the Success Rate of Online Learning?
It depends entirely on which learners you count. Among everyone who registered on edX, certification ran from 4.96% down to 3.13% across five years (Reich and Ruiperez-Valiente, Science, 2019). Among learners who paid for a verified track in those same courses, it ran between 44% and 56% (Reich and Ruiperez-Valiente, 2019). In a 2024 study, 43.08% of learners who actually started the course finished it (Celik and Cagiltay, Open Praxis, 2024).
What Is the Dropout Rate for Online Learning?
Between 94% and 97% if you count every account that ever registered on edX and never certified, because certification among all registered participants ran between 3.13% and 5.91% (Reich and Ruiperez-Valiente, 2019). That’s honest and close to useless for planning, because 52% of those registrants never opened the courseware (Reich and Ruiperez-Valiente, 2019). Pick the population that matches yours before you quote a dropout rate.
What Are the Biggest Challenges of Online Learning?
Intent and attention, not technology. 52% of edX registrants never entered the courseware at all (Reich and Ruiperez-Valiente, 2019), and only 35% of learners in one Columbia study planned to earn the credential they signed up for (Hollands and Kazi, 2018). Price fixes part of it: paying lifted engagement by 8% to 9% (Goli, Chintagunta and Sriram, 2021).
Is Online Learning as Effective as Classroom Learning?
No primary source compares online students with traditional learning cleanly, and any page giving you one percentage is quoting a meta-analysis from a different technological era. Traditional degrees are not a high bar either: only 43% of bachelor’s entrants across 32 OECD and partner countries graduate within the expected duration (OECD, Education at a Glance 2025). The credentials and durations differ, but that’s not an obviously higher bar than the paid online cohorts in the edX data.
How Many People Take Online Courses?
In US higher education, 10,761,754 students took at least one course at a distance in fall 2024 and 5,214,325 took every course that way (NCES, Table 311.15). Globally there is no equivalent count, because no statistical agency collects one. Platform figures are the closest proxy and they overstate: Coursera’s 205 million is a cumulative count of registered accounts (Coursera).
What Are the Current Online Learning Growth Trends?
Enrollment in digital education is growing and investment in it is not. Fully online US enrollment rose 4.7% between fall 2023 and fall 2024 against 3.3% for total enrollment (NCES, Table 311.15). Meanwhile global EdTech venture funding fell to $1.8 billion in 2024, the lowest since 2014 (HolonIQ). Consolidation is the other trend: Coursera absorbed Udemy in May 2026 (Coursera).
How Is AI Changing Online Learning?
The adoption data is clear and the outcome data is not. 84% of US high schoolers used generative AI for schoolwork by May 2025 (College Board) while only 28% of institutions had a formal policy (Tyton Partners, 2025). The commercial effect is visible: Chegg’s academic services revenue fell 61% in a year (Chegg Form 10-Q). Whether any of it improves learning outcomes is still unmeasured.
How Much Does an Online Course Cost?
Podia’s analysis of 132,009 course sales puts the average price at $137 (Podia). That’s the only first-party course-pricing dataset published in the open. Marketplace courses sell for far less and cohort-based courses for far more, so the average describes almost nobody. Structured credentials sit higher: the average MicroMasters cost $960 (Hollands and Kazi, 2018).
Written by
Editorial Staff
The Editorial Staff represents the writers, editors, and content creators who have worked (or work) at Elite Content Marketer. The experimenter-in-chief behind the team is Chintan Zalani, who has close to a decade of experience trying to make sense of the content marketing industry. Started in 2019, Elite Content Marketer is on a mission to help creators build sustainable businesses.
Related Articles
Marketing Data
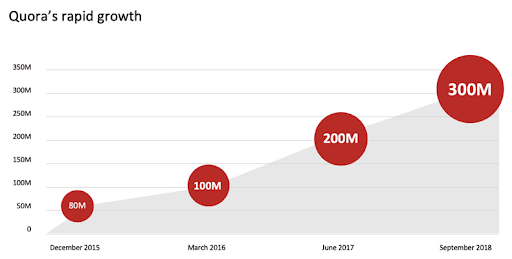
Quora Statistics 2026: 59 Facts on Users, Traffic and Ads
59 Quora statistics for 2026: 400M+ claimed visitors, 306.18M visits, US share, demographics, valuation, AI Overview citations and ad costs.
Oct 26, 2026Read more →
Marketing Data
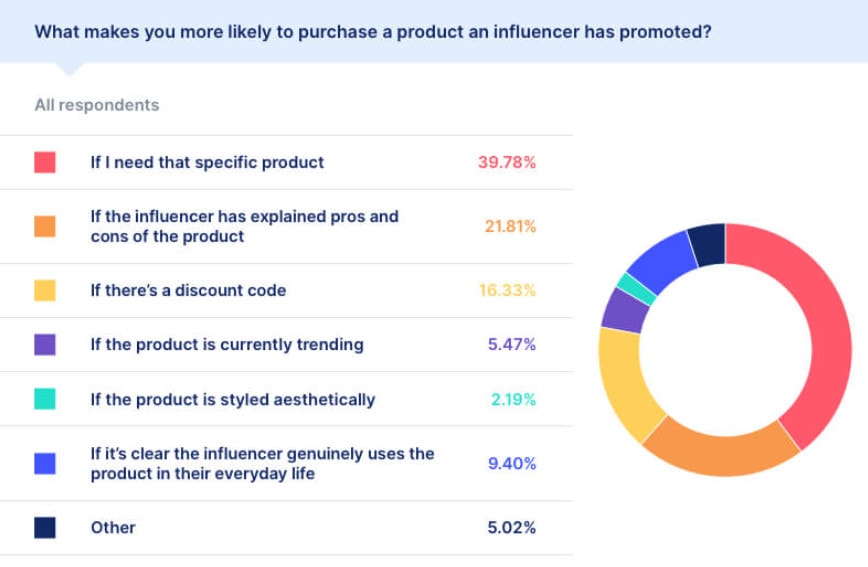
Influencer Marketing Statistics 2026: 60 Facts + $33B Market
60 influencer marketing statistics: a $32.55B industry in 2025, $10.5B US spend, budgets, ROI, platforms, consumer trust, creator pay and burnout.
Oct 25, 2026Read more →
Marketing Data
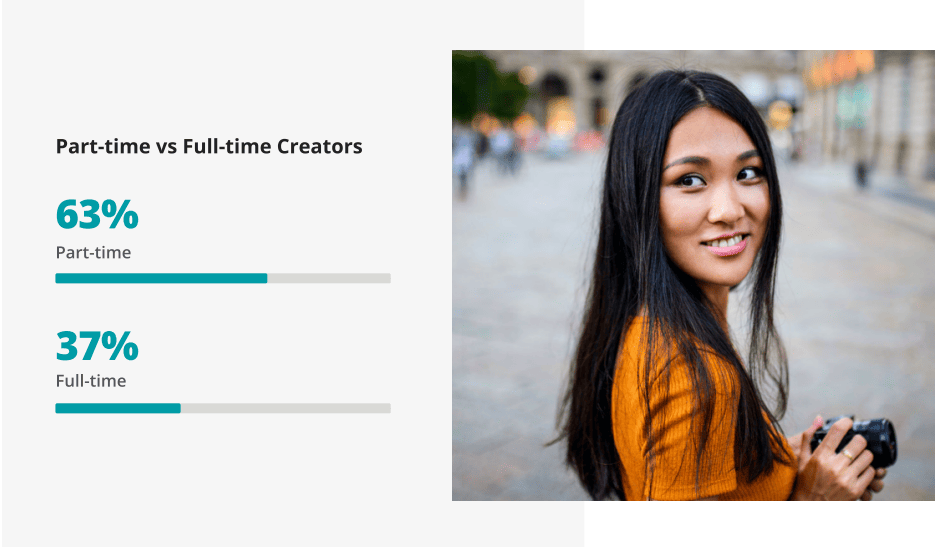
Creator Economy Statistics 2026: 60 Facts + $250B Market
60 creator economy statistics: a $250B market (2023), $37B projected US creator ad spend, 10.1M US independent creators, earnings, AI and burnout.
Oct 24, 2026Read more →