Both numbers come from OpenAI’s own GPT-5 system card, Figures 2 and 3. Nobody had to catch the company out. It published both.
I checked 67 statistics for this piece against the organization that produced each one. Three did not survive, so 64 are below. One in particular, a very precise-looking “32.81% of professionals cite hallucinations as their primary concern” attributed to Stanford’s AI Index, does not appear in the chapter it is credited to. I searched the full text of that chapter. It is not there. That is worth sitting with, given the subject.
Here are the numbers that held up.
Key Takeaways
- Grounding moves the number more than the model does. OpenAI’s o4-mini goes from 5.1% to 37.7% on the same benchmark when you remove its web access. Any hallucination rate quoted without the browsing condition attached is close to meaningless.
- Anthropic reports its newest flagship is both more accurate and more hallucination-prone. Claude Opus 5 is 11% more accurate than Claude Opus 4.8, with a hallucination rate 6% higher.
- “Hallucination rate” names at least four different measurements. Document faithfulness runs 1.8% to 24.2%, closed-book recall 22% to 94%, news false claims 10% to 57%, and citation identification up to 94% wrong. They share a word and nothing else.
- Chatbot accuracy on news got worse while refusals disappeared. NewsGuard’s false-claim rate roughly doubled from 18% to 35% in a year, and the models went from frequently refusing to answering every prompt.
- Courts have documented 2,022 decisions involving AI-hallucinated filings.
- Your buyers check the output. Nearly half of organizations have no step that does. 94% of B2B tech buyers say they fact-check AI answers at least some of the time. Only 54% of organizations include fact-checking in their AI content QC.
Top AI Hallucination Statistics for 2026
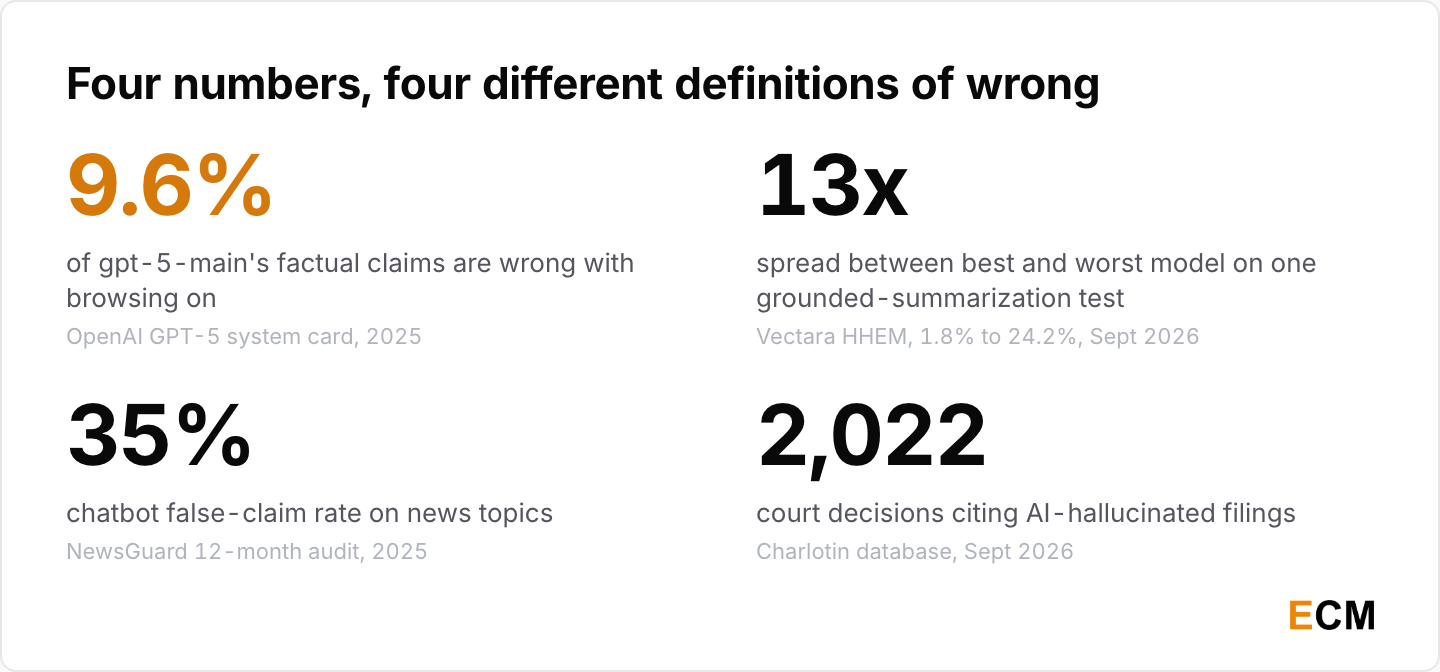
If you carry four numbers into a meeting, carry these.
The Numbers Worth Quoting
1. gpt-5-main gets 9.6% of its factual claims wrong on OpenAI’s production-traffic evaluation with browsing enabled, against 12.9% for GPT-4o (OpenAI, GPT-5 System Card, August 2025). On the same chart, gpt-5-thinking scores 4.5%, so one release spans a twofold range depending on which variant answers.
2. On that same evaluation, 11.6% of gpt-5-main’s responses contain at least one major factual error, against 20.6% for GPT-4o, which OpenAI reports as 44% fewer (OpenAI, GPT-5 System Card, August 2025).
3. Across 106 models tested on grounded summarization, hallucination rates run from 1.8% to 24.2% (Vectara HHEM Leaderboard, continuously updated, table stamped 11 May 2026, accessed 9 September 2026).
4. Ten leading chatbots repeated false claims on news topics 35% of the time in August 2025, up from 18% a year earlier (NewsGuard, AI False Claims Monitor one-year audit, September 2025).
5. 2,022 legal decisions worldwide document parties submitting AI-hallucinated content (Damien Charlotin, AI Hallucination Cases Database, HEC Paris, accessed 9 September 2026).
6. 74% of organizations rate inaccuracy as a highly relevant AI risk, placing it above cybersecurity at 72% (McKinsey, State of AI Trust in 2026, March 2026, roughly 500 organizations surveyed December 2025 to January 2026).
Why These Six and Not the Popular Ones
Each of these traces to the organization that ran the measurement. That sounds like a low bar. Most circulating AI hallucination statistics fail it, because they trace instead to a blog post citing a blog post citing a number nobody can locate.
The four figures in the graphic above are also deliberately mismatched. They measure different things on purpose, which is what the next section is about.
AI Hallucination Rates by Model
Frontier Models on Grounded Summarization
Vectara’s Hughes Hallucination Evaluation Model leaderboard runs the friendliest test in the field. You hand the model a document and ask it to summarize using only what is in front of it. No recall required. The corpus is over 7,700 articles ranging from 50 words to 24,000.
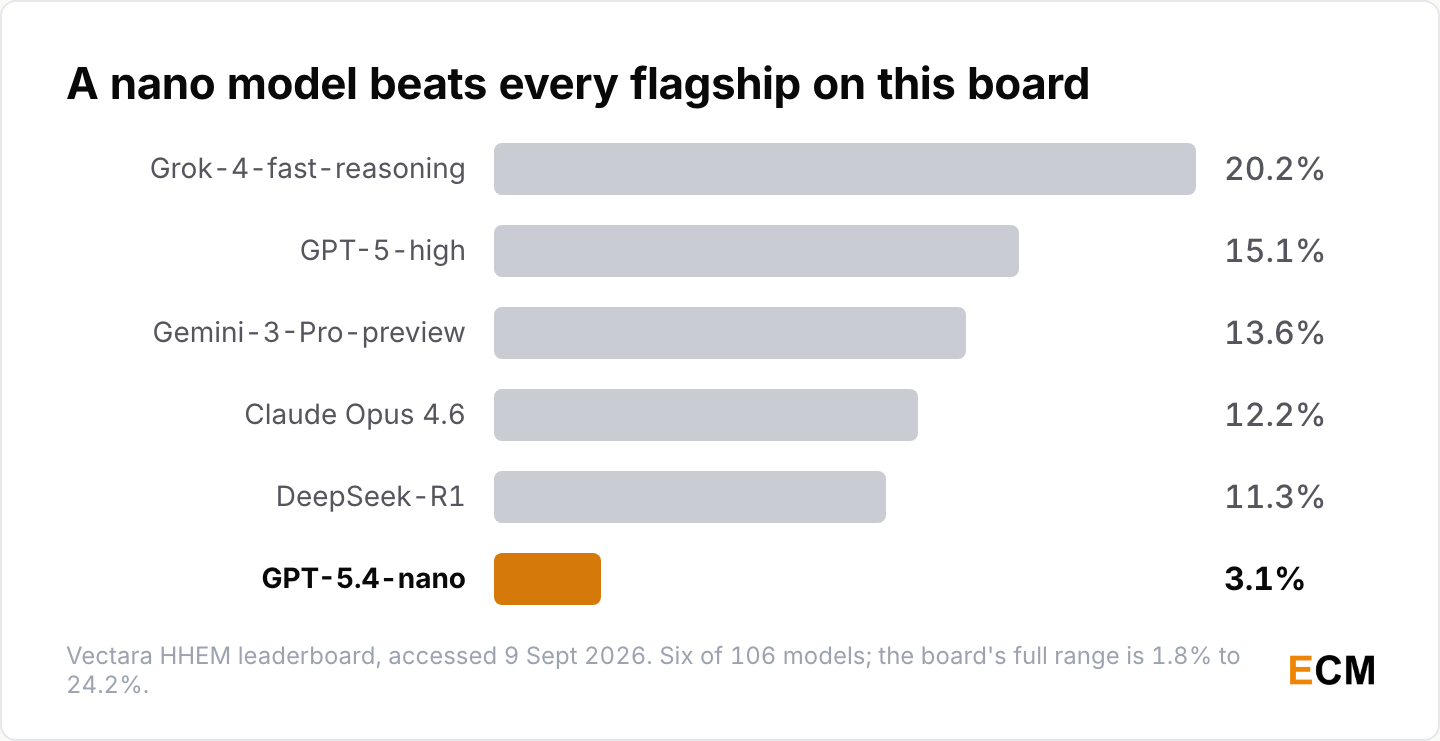
7. Grok-4-fast-reasoning hallucinates on 20.2% of grounded summaries (Vectara HHEM, accessed 9 September 2026).
8. The board’s highest rate is 24.2%, held by Ministral 3 3B, and OpenAI’s o3-pro sits at 23.3% (Vectara HHEM, accessed 9 September 2026).
9. GPT-5-high sits at 15.1% and Gemini-3-Pro-preview at 13.6% (Vectara HHEM, accessed 9 September 2026).
10. Among Anthropic’s models on the board, Claude Haiku 4.5 records 9.8%, Claude Sonnet 4.6 10.6%, Claude Opus 4.5 10.9%, Claude Sonnet 4.5 12.0% and Claude Opus 4.6 12.2% (Vectara HHEM, accessed 9 September 2026).
11. The lowest rate on the board belongs to Ant Group’s finix_s1_32b at 1.8%, followed by GPT-5.4-nano at 3.1% and Gemini-2.5-flash-lite at 3.3% (Vectara HHEM, accessed 9 September 2026).
12. DeepSeek R1, the reasoning model, hallucinates at 11.3% against 6.1% for the DeepSeek V3 base model on the identical task (Vectara HHEM, accessed 9 September 2026).
Note where the best scores sit. A 32-billion-parameter model and a nano-tier model post the two lowest rates on this board, which is a reminder that staying faithful to a document in front of you is a different skill from knowing things. That is one benchmark, not a law about model size.
One caution on citing this source: it updates in place. Any figure from it needs an access date rather than a publication date, because both the model list and the scores change.
What Vendors Report About Their Own Models
13. OpenAI reports gpt-5-thinking makes over five times fewer factual errors than o3 in both browsing settings across three benchmarks (OpenAI, GPT-5 System Card, August 2025).
14. With browsing disabled, 3.1% of GPT-5.2 Thinking’s claims contain a factual error, against 3.2% for GPT-5.1 Thinking and 4.7% for GPT-5 Thinking (OpenAI, GPT-5.2 System Card update, Figure 2, December 2025).
15. Measured at the response level instead, 10.9% of GPT-5.2 Thinking’s browsing-disabled responses contain at least one major factual error, against 12.7% for GPT-5.1 Thinking and 16.8% for GPT-5 Thinking (OpenAI, GPT-5.2 System Card update, Figure 2, December 2025).
16. With browsing enabled, both figures fall, to 0.8% of claims and 5.8% of responses (OpenAI, GPT-5.2 System Card update, Figure 1, December 2025).
17. On business and marketing research prompts specifically, with browsing enabled, GPT-5.2 Thinking hallucinates on 0.7% of claims, against 1.1% for GPT-5.1 Thinking (OpenAI, GPT-5.2 System Card update, Figure 3, December 2025).
18. OpenAI’s o3 hallucinated on 33% of PersonQA questions and o4-mini on 48%, against 16% for o1 (OpenAI, o3 and o4-mini System Card, April 2025).
19. The earlier o3-mini scored 14.8% on the same PersonQA measure, where GPT-4o scored 52.4% (OpenAI, o3-mini System Card, February 2025).
Stats 14 and 15 are the same model on the same test in the same figure, and they differ by a factor of three. One counts wrong claims, the other counts responses containing at least one bad claim. Coverage quotes whichever is more dramatic and rarely says which. If you take one habit from this article, make it asking which denominator a hallucination rate uses.
Every number in this cluster is also self-graded. OpenAI’s production-traffic evaluation uses an LLM grader with web access, and the company reports 75% agreement between that grader and human assessors. Disclosing that is the right call. It is still a vendor grading its own homework with a tool it built.
Closed-Book Factuality and the Abstention Trade-Off
Anthropic reports factuality differently, on AA-Omniscience, a 41-topic closed-book benchmark with no web search available. Every answer is graded correct, incorrect, or an abstention, and the headline is a net score of correct minus incorrect, so a model that guesses confidently gets punished.
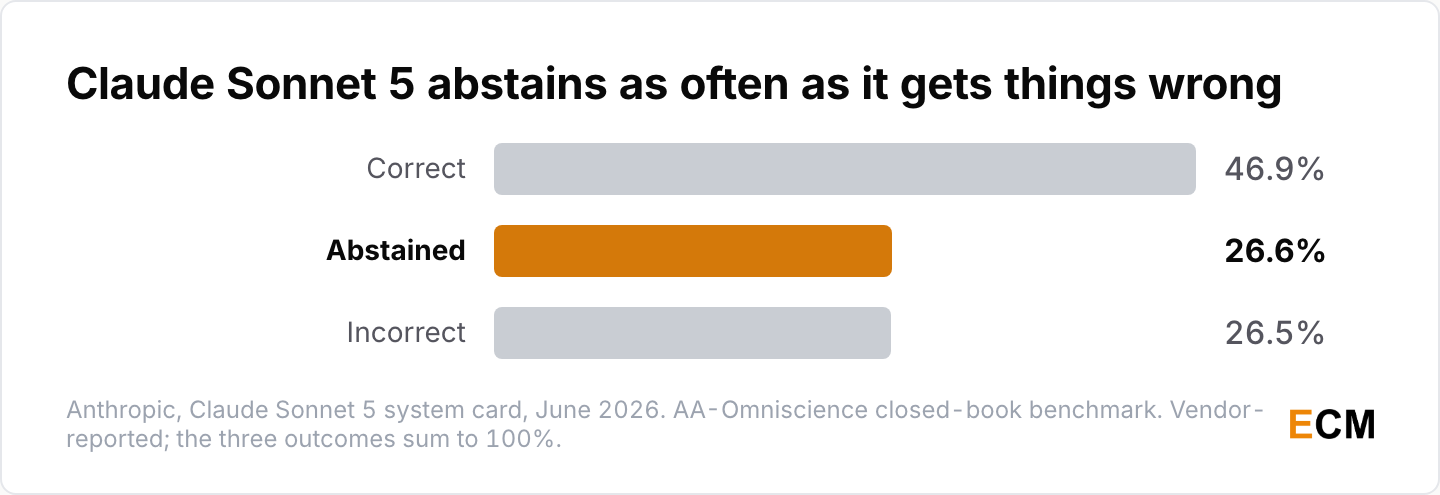
20. Claude Sonnet 5 answers 46.9% of closed-book factual questions correctly, gets 26.5% wrong, and declines to answer 26.6% (Anthropic, Claude Sonnet 5 System Card, June 2026).
21. On incorrect-rate, which Anthropic calls the most direct measure of factual hallucination, Claude Opus 4.6 records 30.3% and Claude Sonnet 4.6 records 35.0% (Anthropic, Claude Sonnet 5 System Card, June 2026).
22. Claude Sonnet 5 declines to answer more often than any earlier model in Anthropic’s comparison set, 26.6% against 5.7% for Claude Mythos 5 (Anthropic, Claude Sonnet 5 System Card, June 2026).
23. Claude Opus 5 is 11% more accurate than Claude Opus 4.8, and its hallucination rate is 6% higher (Anthropic, Claude Opus 5 System Card, July 2026).
Anthropic flags that the Sonnet 5 training run was unhealthy in its second half, so stats 20 to 22 may reflect that rather than a clean calibration result. The company says so in the same paragraph where it publishes the numbers, which is the standard the rest of this field should be held to.
Statistic 23 is the one I would put in front of anyone who believes this problem is being solved on a schedule. A newer flagship got better at knowing things and worse at admitting when it does not. Those two move independently, and Anthropic reports both.
Why Published Hallucination Rates Disagree So Much
Four Different Things Called Hallucination
The 1.8% figure and the 94% figure in this article are both correct. They are not measuring the same event.
24. Faithfulness to a supplied document produces the lowest numbers, 1.8% to 24.2% across 106 models (Vectara HHEM, accessed 9 September 2026).
25. Closed-book factual recall produces the widest published range. On AA-Omniscience, hallucination rates across 26 models run from 22% to 94% (Stanford HAI, AI Index Report 2026, Responsible AI chapter, April 2026, Figure 3.2.6, reproducing Artificial Analysis data).
26. At the low end of that benchmark sit Grok 4.20 Beta 0305 at 22%, Claude 4.5 Haiku at 26% and MiMo-V2-Pro at 30%. At the high end, gpt-oss-20B reached 94% and Gemini 3 Flash 92% (Stanford HAI, AI Index Report 2026, April 2026).
27. False claims on news topics produce a third range, 10% to 57% across ten chatbots (NewsGuard, September 2025).
28. Citation identification produces a fourth. Asked to name the source of a quoted passage, one tool answered 94% of queries incorrectly (Tow Center for Digital Journalism, March 2025).
Four measurements, four denominators, one word. A model can score 1.8% on the first and much higher on the second without either number being wrong, because the first hands it the answer and the second does not.
Knowing Something Is Not the Same as Believing It
29. On KaBLE, a 13,000-question benchmark across 13 tasks and 24 models, GPT-4o’s accuracy falls from 98.2% on true-belief tasks to 64.4% on first-person false beliefs, and DeepSeek R1 falls from over 90% to 14.4% (Stanford HAI, AI Index Report 2026, April 2026, Figure 3.2.8).
30. Models handle third-person false beliefs far better than first-person ones. Newer models reach 95% accuracy on third-person false beliefs but 62.6% on first-person ones (Stanford HAI, AI Index Report 2026, April 2026).
This is a separate finding from stat 25, and the two get merged constantly, including in short summaries of the report itself. KaBLE measures whether a model can tell knowledge from belief. AA-Omniscience measures closed-book factual recall. Quoting the 22% to 94% range as evidence that models collapse under adversarial framing merges two studies that share a chapter and nothing else.
The practical version: tell a model “I believe X” when X is false, and its accuracy drops in a way it does not when you say “someone else believes X.”
Grounding Changes the Number More Than the Model Does
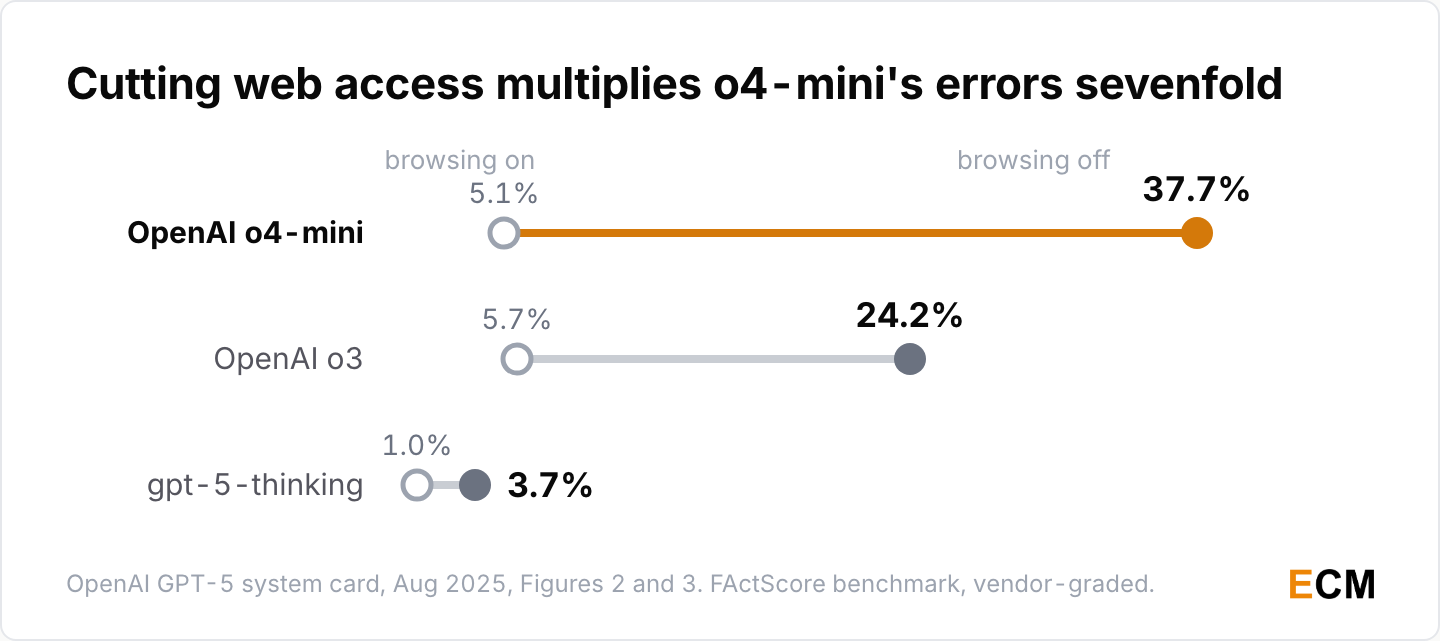
31. On FActScore with browsing enabled, gpt-5-thinking scores 1.0%, o3 scores 5.7%, and o4-mini scores 5.1% (OpenAI, GPT-5 System Card, Figure 2, August 2025).
32. With browsing disabled, those same three score 3.7%, 24.2%, and 37.7% (OpenAI, GPT-5 System Card, Figure 3, August 2025).
33. On LongFact-Concepts with browsing enabled, gpt-5-thinking scores 0.7% against o3 at 4.5% (OpenAI, GPT-5 System Card, Figure 2, August 2025).
34. GPT-4o search preview scores 90% on SimpleQA, where standard GPT-4o scores 38.2% and o1-preview 42.7% on the same 4,326-question set (OpenAI, March 2025; Wei et al., SimpleQA, November 2024).
For o4-mini, removing web access multiplies the error rate by more than seven, on one benchmark, in the vendor’s own evaluation. That is a large enough effect to design around. If you are choosing between a better model and a better retrieval layer, this evidence points at the retrieval layer.
Who Grades the Grader
35. ChatGPT scored 58.3% on FActScore for biographical writing, and in that evaluation a generated sentence contained an average of 4.4 distinct pieces of information, 40% of which mixed supported and unsupported claims (Min et al., FActScore, May 2023).
Statistic 35 is from 2023 and I am not offering it as current model performance. It is here because that 4.4-claims-per-sentence finding explains why “is this output accurate” is a badly formed question. In that evaluation a sentence was not one claim, and its parts could be independently right and wrong.
Are AI Hallucinations Getting Better or Worse?
Both, on different axes, and an honest answer has to say which axis.
Frontier Factuality Improved
36. OpenAI’s headline production-traffic rate improved from 12.9% for GPT-4o to 9.6% for gpt-5-main, a 26% relative reduction (OpenAI, GPT-5 System Card, August 2025).
37. GPT-5.5’s individual claims are 23% more likely to be factually correct than GPT-5.4’s on a hallucination-prone subset of flagged conversations (OpenAI Deployment Safety Hub, April 2026).
Both of those are OpenAI measuring OpenAI, on OpenAI’s own grader.
News Accuracy Went the Other Way
38. The average false-claim rate across ten leading chatbots rose from 18% in August 2024 to 35% in August 2025 (NewsGuard, September 2025).
39. NewsGuard’s broader fail rate, which counts both false claims and refusals to debunk, fell from 49% to 35% over the same year, because the chatbots went from frequently refusing to answering prompts 100% of the time (NewsGuard, September 2025).
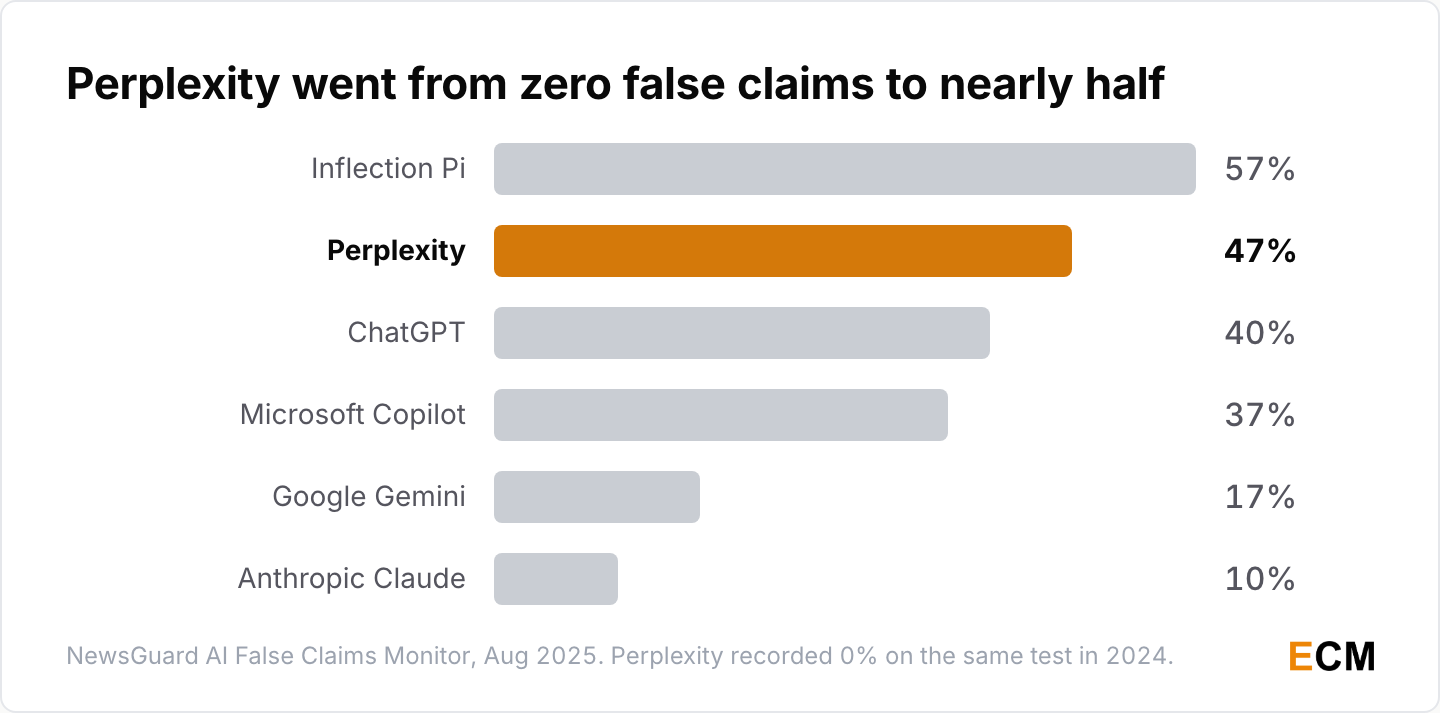
40. By model in August 2025, rounded to whole numbers: Inflection Pi 57%, Perplexity 47%, ChatGPT 40%, Meta AI 40%, Copilot 37%, Mistral 37%, Grok 33%, You.com 33%, Gemini 17%, Claude 10% (NewsGuard, September 2025).
41. Perplexity moved from zero false claims in 2024 to 47% in August 2025 (NewsGuard, September 2025).
Stats 38 and 39 belong together, and separating them produces a false story. The false-claim rate rose while refusals went to zero. NewsGuard’s own framing is that last year the chatbots cautiously refused and this year they answered everything. The audit reports the two movements together without quantifying how much of the rise the disappearing refusals account for, so treat that as the direction of travel rather than a measured cause.
42. The AI Incident Database recorded 362 incidents in 2025, up from 233 in 2024, a 55% increase (Stanford HAI, AI Index Report 2026, April 2026).
AI Search, Citations, and Real-World Consequences
43. Across 1,600 queries, 200 article excerpts run through each of eight generative search tools, chatbots gave incorrect answers to more than 60% (Tow Center for Digital Journalism, AI Search Has a Citation Problem, March 2025).
44. Error rates within that study ranged from 37% for Perplexity to 94% for Grok-3 (Tow Center, March 2025).
45. 154 of Grok-3’s 200 citations led to error pages (Tow Center, March 2025).
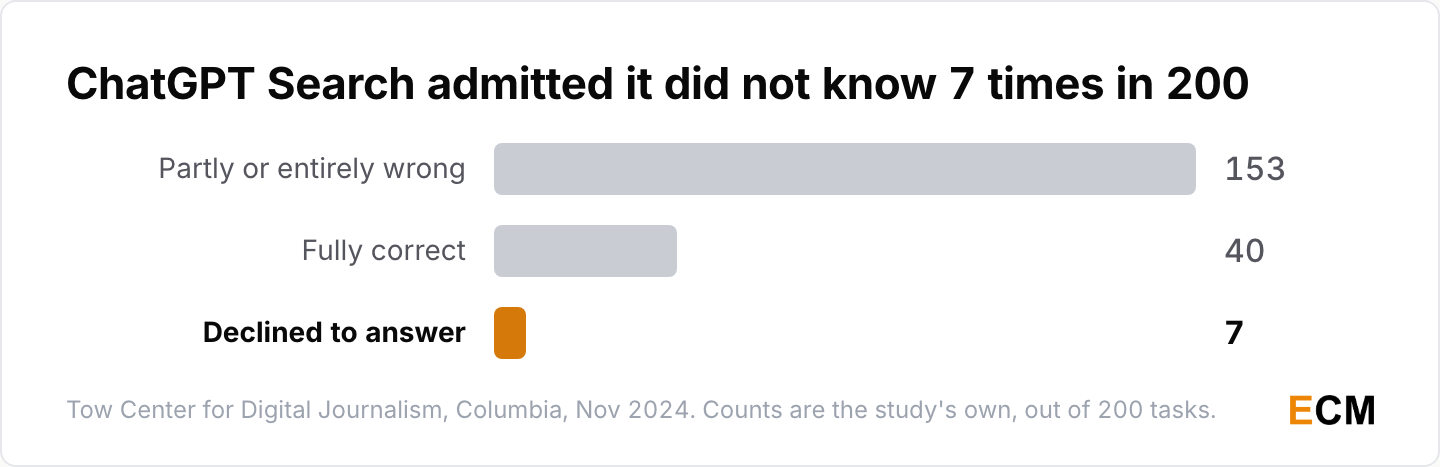
46. In an earlier study of 200 ChatGPT Search queries, 153 responses were partially or entirely incorrect, while the tool acknowledged an inability to answer only 7 times (Tow Center, How ChatGPT Search Misrepresents Publisher Content, November 2024).
47. The paid tiers answered more prompts correctly than their free counterparts and also produced more incorrect answers, because they declined to answer less often (Tow Center, March 2025).
48. Publisher licensing deals provided no guarantee of accurate citation (Tow Center, March 2025).
Statistic 47 is the one that should change how you buy. The premium tiers were better and worse at once, producing more right answers and more wrong ones, because they guessed where the free versions declined. If you assumed the paid tier is the careful tier, that assumption has been tested and it is only half true.
What It Costs in Court
49. Courts worldwide have documented 2,022 decisions involving AI-hallucinated content (Damien Charlotin, AI Hallucination Cases Database, accessed 9 September 2026). The database tracks decisions where a court addressed hallucinated content directly, not every instance of AI use in filings, and it includes some cases where AI use was alleged rather than confirmed.
50. General-purpose models hallucinated on legal queries at rates from 58% for GPT-4 to 88% for Llama 2, with GPT-3.5 at 69% (Dahl, Magesh, Suzgun and Ho, Large Legal Fictions, Stanford RegLab, April 2024).
51. Purpose-built legal research tools still hallucinated on 17% of 202 preregistered queries for Lexis+ AI and Practical Law AI, and 33% for Westlaw AI-Assisted Research, against 43% for GPT-4 (Magesh et al., Hallucination-Free?, Stanford RegLab, May 2024).
52. In Mata v. Avianca, attorneys were sanctioned $5,000 after filing six fabricated case citations produced by ChatGPT, which had assured them the cases were real and findable on Westlaw (S.D.N.Y. Opinion and Order on Sanctions, 22-cv-1461, June 2023).
53. In Moffatt v. Air Canada, the tribunal rejected the argument that the airline’s chatbot was a separate legal entity and awarded CAD $812.02 (2024 BCCRT 149, February 2024).
Statistic 51 deserves emphasis because those tools were sold specifically as the fix. Retrieval-grounded, domain-specific, marketed against exactly this failure mode, and still wrong on a third of queries in one case.
What the Numbers Mean for Content Marketers
Your Buyers Already Check the Output
54. 94% of B2B technology buyers who used AI during their purchase research said they fact-check its responses at least some of the time (TrustRadius, 2026 B2B Buying Disconnect Report, published July 2026, fielded January 2026, 1,862 buyers and 444 vendors).
55. 63% of surveyed technology buyers used AI somewhere in the purchase journey (TrustRadius, July 2026).
Most Teams Have Fewer Checks Than Their Readers Do
56. 54% of organizations add fact-checking to their AI content QC, 42% add legal or compliance review, and 27% conduct bias evaluation (Fractl, AI Search Consumer Trust Study, Q2 2026, 1,008 US consumers and 150 marketers).
57. Only 20% of organizations always disclose AI use to their audiences, and 33% never disclose (Fractl, Q2 2026).
58. The share of consumers saying heavy AI use would decrease their trust in a favorite brand rose from 20% to 40% in twelve months (Fractl, Q2 2026).
Put 54 and 56 side by side, carefully. 94% of buyers who used AI say they check its answers at least sometimes. 54% of organizations have a fact-checking step in their AI content pipeline at all. These are different surveys with different populations, and neither measures how often any individual output gets verified. What they do show is an asymmetry worth taking seriously: nearly half of the organizations producing AI-assisted content have no verification step, while the people reading it mostly do.
That is the practical argument for a fact-checking step, and it is worth more than any benchmark number here. For the operational version, the rules that keep an AI content pipeline out of trouble are in AI content governance, and the editing workflow itself is in AI-generated marketing content.
59. 29% of employees, and 44% of Gen Z employees, admit to actively sabotaging their organization’s AI strategy (WRITER with Workplace Intelligence, 2026 AI Adoption in the Enterprise, April 2026, 1,200 employees and 1,200 executives).
60. Only 29% of organizations see significant ROI from generative AI, and 23% from AI agents (WRITER, April 2026).
61. 51% of organizations using AI reported at least one negative consequence, with nearly a third citing consequences from AI inaccuracy specifically (McKinsey, State of AI Global Survey 2025, November 2025, 1,993 participants across 105 nations).
What Actually Reduces Hallucination Rates
Retrieval Helps, and the Real Numbers Are Smaller Than the Marketing
62. Retrieval-augmented generation was introduced as a way to combine a pre-trained sequence-to-sequence model with a Wikipedia dense vector index, producing “more specific, diverse and factual language than a state-of-the-art parametric-only seq2seq baseline” (Lewis et al., May 2020).
63. Contextual embeddings cut top-20 retrieval failure rate by 35%, from 5.7% to 3.7%. Adding contextual BM25 reached 49%, and adding reranking reached 67%, from 5.7% to 1.9% (Anthropic, Contextual Retrieval, September 2024).
Statistic 63 gets misquoted more than anything else here. Those percentages measure retrieval failure rate, whether the system fetched the right chunk. They do not measure whether the answer was true. “Contextual retrieval reduces hallucinations by 67%” is a claim the source never makes.
Abstention Is the Underrated Lever
64. OpenAI’s gpt-5-thinking-mini abstains on 52% of questions and errs on 26%, where o4-mini abstains on 1% and errs on 75%, despite o4-mini scoring slightly higher raw accuracy at 24% against 22% (OpenAI, Why Language Models Hallucinate, September 2025).
Statistic 64 is the cleanest illustration of the whole problem. o4-mini looks marginally better on the metric most people quote, accuracy, while being wrong about 2.9 times as often. It manages that by declining to answer only 1% of the time. Benchmarks that reward attempting everything produce models that attempt everything.
That comparison is between two different models rather than a controlled test of one instruction, so read it as a reason to look at accuracy, error rate and abstention together rather than as proof that any particular prompt works.
Frequently Asked Questions
What Is the AI Hallucination Rate in 2026?
There is no single rate, and any article giving you one is hiding its methodology. On grounded summarization, current models range from 1.8% to 24.2%. On closed-book factual recall, the AA-Omniscience range across 26 models is 22% to 94%. In NewsGuard’s August 2025 audit, ten leading chatbots repeated false claims on news topics 35% of the time. Always ask which test, and whether the model had web access.
Which AI Has the Highest Hallucination Rate?
It depends entirely on the test. On Vectara’s grounded summarization leaderboard, the highest rate belongs to Ministral 3 3B at 24.2%, with o3-pro at 23.3% and Grok-4-fast-reasoning at 20.2%. On NewsGuard’s news-topic audit for August 2025, Inflection Pi was highest at 57% and Perplexity second at 47%. On the Tow Center’s citation study, Grok-3 answered 94% of queries incorrectly. No model tops all three lists.
Do Reasoning Models Hallucinate More Than Base Models?
Sometimes. DeepSeek R1 hallucinates at 11.3% against the V3 base model’s 6.1% on the same grounded summarization task. OpenAI’s o3 reached 33% on PersonQA against o1’s 16%. But GPT-5’s thinking variants reverse the pattern on OpenAI’s own benchmarks, where gpt-5-thinking beats gpt-5-main. Treat “reasoning models hallucinate more” as a real observed effect in specific model families and evaluations, not a law.
What Is the 30% Rule in AI?
The sources verified for this article do not establish any formal 30% rule, or any measured link between that phrase and hallucination rates. It circulates as a management rule of thumb rather than a benchmark result. If someone quotes it to you as a measured figure, treat that as a reason to check the rest of their numbers.
Are AI Hallucinations Getting Worse?
It depends which measurement. OpenAI reports improvement between GPT-4o and GPT-5 on its own evaluation. Anthropic reports Claude Opus 5 as both more accurate and more hallucination-prone than Opus 4.8. NewsGuard’s false-claim rate on news rose from 18% to 35% in a year while refusals fell to zero. The trend is genuinely mixed, and anyone telling you it is a clean line in either direction is selling something.
Does RAG Eliminate Hallucinations?
No. It reduces them substantially in the evaluations that measure it. OpenAI’s o4-mini goes from 37.7% to 5.1% on FActScore with browsing enabled, the largest single improvement in this article. But purpose-built legal RAG tools still hallucinated on 17% to 33% of queries in Stanford’s preregistered study, despite being marketed against exactly that failure. Retrieval is the single most effective fix in the evidence here, and it is not a cure.
How Many Lawyers Have Been Caught Citing Hallucinated Cases?
The AI Hallucination Cases Database maintained by Damien Charlotin at HEC Paris documented 2,022 legal decisions worldwide as of September 2026, spanning the United States, United Kingdom, Israel, Canada, Australia, Brazil, the Netherlands, Italy, Ireland, Spain, South Africa and Trinidad and Tobago. Charlotin told NPR in April 2026 that the database had recently logged ten cases from ten different courts in a single day (TaxProf Blog, quoting NPR, April 2026).
Sources and Methodology
Every statistic above was checked against the organization that produced it, not against a secondary summary. Where a primary URL blocked automated access, the figure was confirmed against the same document retrieved through an archive or against the source’s own published chart data, and those substitutions are noted here.
Two claims were removed during verification and one was cut back to what its source supports.
A widely circulated triplet stating that 32.81% of professionals cite hallucinations and data reliability as their primary generative AI concern, against 18.75% for high costs and 17.19% for unclear ROI, is attributed across the web to Stanford’s AI Index 2025. A full-text search of the chapter it is credited to returns none of those three figures, and that chapter’s comparable table asks an entirely different question. The triplet has no traceable underlying survey and was dropped.
A figure attributed to Deloitte’s 2026 enterprise AI report was dropped because that release contains no accuracy, trust or verification figure at all.
A claim that 29% of employees sabotage AI rollouts specifically by entering proprietary data into unauthorized tools, deliberately generating low-quality output, or refusing mandated tools was cut back to what the source supports. WRITER’s survey reports the 29% sabotage figure, and separately reports that 35% entered proprietary information into public AI tools. It does not connect those behaviours to the sabotage statistic, so only the supported part appears above as stat 59.
A second review pass corrected several figures in an earlier draft of this article. The Vectara HHEM leaderboard is continuously updated rather than a fixed 2025 snapshot, so its figures carry an access date, and its full range is 1.8% to 24.2% rather than the narrower range that draft used. DeepSeek R1 and V3 currently score 11.3% and 6.1%, not the 14.3% and 3.9% that circulate widely. The GPT-5.2 system card figures were restated to distinguish claim-level rates from response-level rates, which that card publishes side by side in the same figures and which an earlier draft merged. The Tow Center study ran 1,600 queries rather than 200. And the AA-Omniscience range was separated from the KaBLE belief findings, because the AI Index summarizes both in one place and they are routinely merged into a single claim.
A claim that GPT-5 hallucinates on 47% of fact-seeking prompts without internet access was excluded. The figure appears verbatim in a Malaysian Family Physician editorial, which attributes it to OpenAI’s GPT-5 system card. That figure does not appear in the system card. The browsing-disabled figures published there are lower, and they are cited directly above instead.
Vendor-reported figures are labelled as such throughout. OpenAI’s production-traffic evaluation is graded by an OpenAI model, with 75% agreement against human assessors disclosed in the card. Anthropic’s factuality figures come from its own system cards. NewsGuard, the Tow Center, Stanford RegLab and Stanford HAI are independent of the models they evaluate. Vectara does not build the models it ranks, but it sells retrieval tooling and scores its leaderboard with its own evaluator model, which is a weaker form of independence than the others.
Survey figures carry their sample size and fielding date where the source published one. The McKinsey State of AI Trust figures come from roughly 500 organizations surveyed between December 2025 and January 2026. The State of AI Global Survey consequence figures are drawn from the 1,753 respondents at organizations using AI, a subset of the full 1,993-participant sample. NewsGuard publishes its per-model percentages inside a chart image rather than in text, so stat 40 is read from that chart and rounded to whole numbers.
Related statistics collections on this site, built to the same standard, cover content marketing, SEO and digital marketing.
Primary Sources
- OpenAI, GPT-5 System Card, August 2025: https://cdn.openai.com/gpt-5-system-card.pdf
- OpenAI, Update to GPT-5 System Card: GPT-5.2, December 2025: https://cdn.openai.com/pdf/3a4153c8-c748-4b71-8e31-aecbde944f8d/oai_5_2_system-card.pdf
- OpenAI, o3 and o4-mini System Card, April 2025: https://cdn.openai.com/pdf/2221c875-02dc-4789-800b-e7758f3722c1/o3-and-o4-mini-system-card.pdf
- OpenAI, o3-mini System Card, February 2025: https://cdn.openai.com/o3-mini-system-card-feb10.pdf
- OpenAI, Why Language Models Hallucinate, September 2025: https://openai.com/index/why-language-models-hallucinate/
- OpenAI, New Tools for Building Agents, March 2025: https://openai.com/index/new-tools-for-building-agents/
- OpenAI Deployment Safety Hub, GPT-5.5 Evaluations With Challenging Prompts, April 2026: https://deploymentsafety.openai.com/gpt-5-5/evaluations-with-challenging-prompts
- Wei et al. (OpenAI), Measuring Short-Form Factuality in Large Language Models, November 2024: https://arxiv.org/pdf/2411.04368
- Anthropic, Claude Sonnet 5 System Card, June 2026: https://www-cdn.anthropic.com/283ef97c476cf442c91d9a37d5b214242a55bb92/Claude%20Sonnet%205%20System%20Card.pdf
- Anthropic, Claude Opus 5 System Card, July 2026: https://www-cdn.anthropic.com/c5fbac3f0b1280a933ebd26d3cb8bb9f5bdeaf48/Claude%20Opus%205%20System%20Card.pdf
- Anthropic, Contextual Retrieval, September 2024: https://www.anthropic.com/news/contextual-retrieval
- Vectara, Hughes Hallucination Evaluation Model Leaderboard, accessed 9 September 2026: https://github.com/vectara/hallucination-leaderboard
- Min et al., FActScore, May 2023: https://arxiv.org/abs/2305.14251
- Lewis et al., Retrieval-Augmented Generation for Knowledge-Intensive NLP Tasks, May 2020: https://arxiv.org/abs/2005.11401
- Dahl, Magesh, Suzgun and Ho, Large Legal Fictions, April 2024: https://arxiv.org/pdf/2401.01301
- Magesh et al., Hallucination-Free? Assessing the Reliability of Leading AI Legal Research Tools, May 2024: https://arxiv.org/pdf/2405.20362
- Damien Charlotin, AI Hallucination Cases Database, HEC Paris, accessed 9 September 2026: https://www.damiencharlotin.com/hallucinations/
- Mata v. Avianca, Inc., S.D.N.Y. Opinion and Order on Sanctions, 22-cv-1461, June 2023: https://law.justia.com/cases/federal/district-courts/new-york/nysdce/1:2022cv01461/575368/54/
- Moffatt v. Air Canada, 2024 BCCRT 149, February 2024: https://www.canlii.org/en/bc/bccrt/doc/2024/2024bccrt149/2024bccrt149.html
- NewsGuard, AI False Claims Monitor One-Year Audit, September 2025: https://www.newsguardtech.com/press/newsguard-one-year-ai-audit-progress-report-finds-that-ai-models-spread-falsehoods-in-the-news-35-of-the-time/
- Tow Center for Digital Journalism, AI Search Has a Citation Problem, March 2025: https://www.cjr.org/tow_center/we-compared-eight-ai-search-engines-theyre-all-bad-at-citing-news.php
- Tow Center for Digital Journalism, How ChatGPT Search Misrepresents Publisher Content, November 2024: https://www.cjr.org/tow_center/how-chatgpt-misrepresents-publisher-content.php
- Stanford HAI, AI Index Report 2026, Responsible AI chapter, April 2026: https://hai.stanford.edu/assets/files/ai_index_report_2026_chapter_3_responsible_ai.pdf
- Stanford HAI, AI Index Report 2025, Chapter 3, April 2025: https://hai.stanford.edu/assets/files/hai_ai-index-report-2025_chapter3_final.pdf
- McKinsey, State of AI Trust in 2026, March 2026: https://www.mckinsey.com/capabilities/tech-and-ai/our-insights/tech-forward/state-of-ai-trust-in-2026-shifting-to-the-agentic-era
- McKinsey, The State of AI Global Survey 2025, November 2025: https://www.mckinsey.com/capabilities/quantumblack/our-insights/the-state-of-ai
- WRITER with Workplace Intelligence, 2026 AI Adoption in the Enterprise Survey, April 2026: https://writer.com/blog/enterprise-ai-adoption-2026/
- TrustRadius, 2026 B2B Buying Disconnect Report, July 2026: https://www.prnewswire.com/news-releases/trustradius-2026-b2b-buying-disconnect-report-reveals-ai-has-changed-how-buyers-research-but-not-what-they-trust-302825792.html
- Fractl, AI Search Consumer Trust Study, Q2 2026: https://www.frac.tl/ai-statistics/
- TaxProf Blog, Worldwide Tally of Legal Decisions Involving AI Hallucinations, quoting NPR, April 2026: https://taxprofblog.aals.org/2026/04/08/worldwide-tally-of-legal-decisions-involving-ai-hallucinations/