Viewers watched a record 31.7 billion hours of live streams in Q3 2026 across the platforms Streams Charts tracks (Streams Charts, Q3 2026 Global Livestreaming Landscape, 2026). These live streaming statistics put YouTube far ahead of Twitch, with Kick growing fastest.
Live Streaming Statistics 2026: 59 Facts and Trends
 Written by Editorial Staff

Key Takeaways
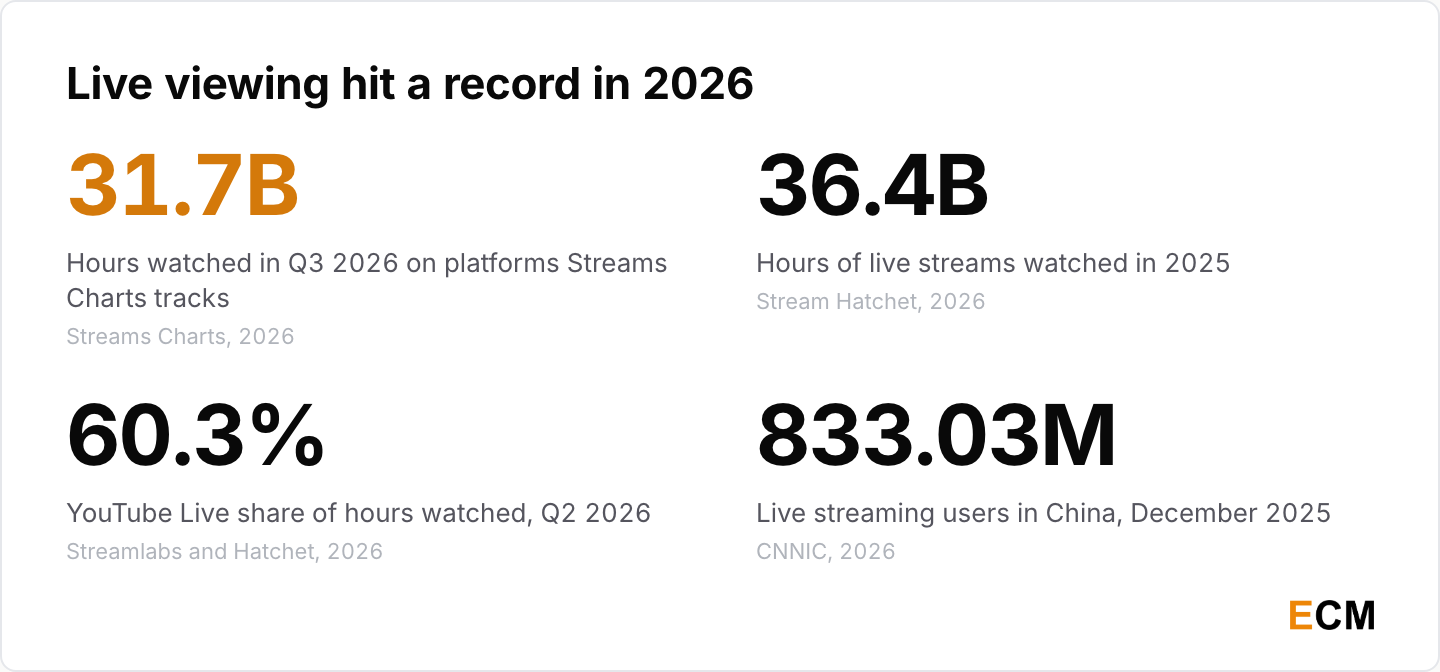
- Viewing is at a record. Platforms tracked by Streams Charts logged 31.7 billion hours watched in Q3 2026, up 0.8% on the quarter (Streams Charts, 2026).
- 2025 nearly matched the pandemic peak. Stream Hatchet counted 36.4 billion hours watched in 2025, up 6% on 2024 (Stream Hatchet, 2025 Yearly Report, 2026).
- YouTube is the biggest live platform. YouTube Live took 60.3% of hours watched in Q2 2026, against 21.0% for Twitch (Streamlabs and Hatchet, Q2 2026 report, 2026).
- Kick is the fastest grower. Kick’s hours watched rose 131% in 2025 to 4.5 billion (Stream Hatchet, 2026).
- About a quarter of internet users watch live every week. Live streams reached 26.4% of internet users weekly in Q2 2026 (Statista, 2026).
- China is the live shopping benchmark. China had 813.59 million live streaming users in December 2025, 72.3% of its internet users (CNNIC, 57th Statistical Report, 2026).
Live Streaming Market Size and Growth Statistics
Research firms put the live streaming market above $80 billion in 2025, and viewing hours are back near their 2021 high.
How Big Is the Live Streaming Market?
Market sizing firms agree on the direction and disagree on the size. I’d quote one firm by name rather than average them.
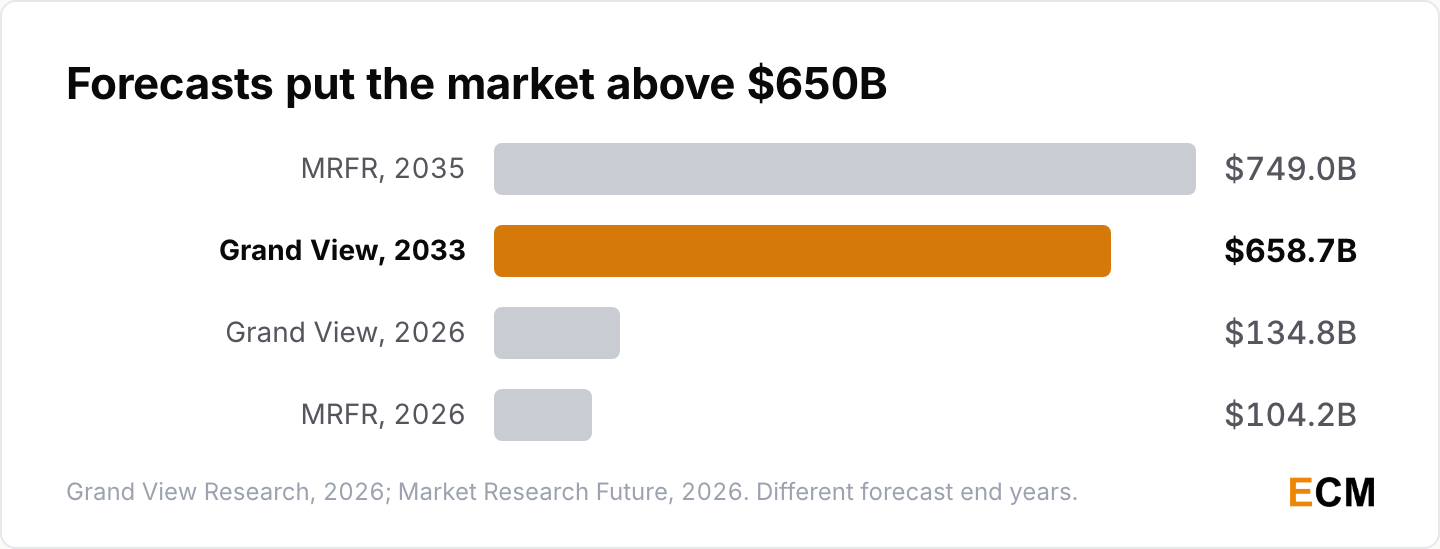
- Grand View Research valued the global live streaming market at $115.2 billion in 2025 and projects $134.8 billion in 2026 and $658.7 billion by 2033, a 25.4% CAGR (Grand View Research, Live Streaming Market Report, 2026).
- Market Research Future estimates $82.24 billion in 2025, $104.20 billion in 2026 and $749.00 billion by 2035, a 24.50% CAGR (Market Research Future, Live Streaming Market, 2026).
- Market Research Future’s 2022 edition projected $534.37 billion by 2030 at a 29.3% CAGR (Market Research Future, 2022).
Is Live Streaming Still Growing?
Yes. Hours watched fell for two years after 2021, then climbed back in 2024 and 2025.
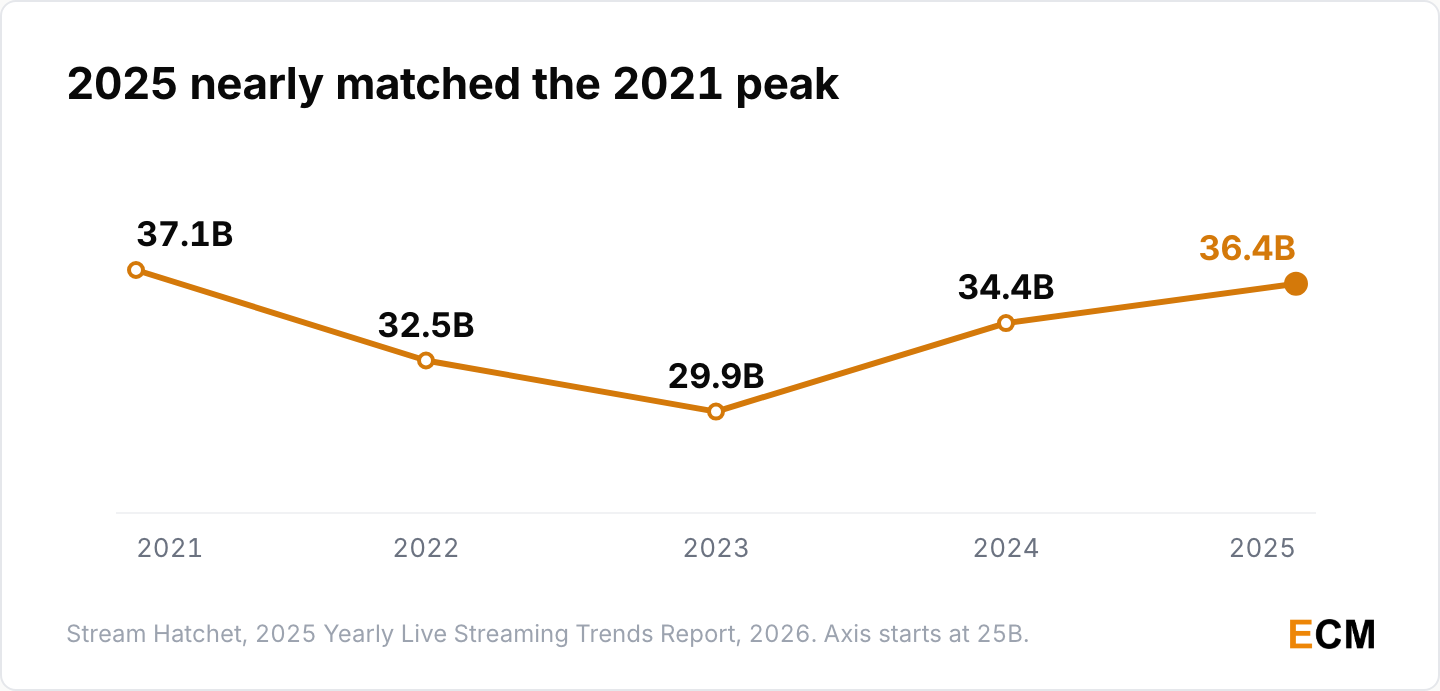
- Live streaming viewership reached 36.4 billion hours in 2025, up 6% on 2024 and the highest total since 2021 (Stream Hatchet, 2025 Yearly Report, 2026). Weekly viewing peaked at 810 million hours in July 2025 (Stream Hatchet, 2025 Yearly Report (PDF), 2026).
- Yearly hours watched went from 37.1 billion in 2021 to 32.5 billion in 2022, 29.9 billion in 2023 and 34.4 billion in 2024 (Stream Hatchet, 2025 Yearly Report (PDF), 2026).
Live Streaming Viewership and Audience Reach Statistics
Total viewing keeps setting quarterly records, but each tracker counts a different set of platforms, so name the tracker every time you quote a total.
How Many Hours Were Watched in Q3 2026?
Streams Charts, which includes YouTube Live and TikTok LIVE, puts quarterly viewing above 31 billion hours.
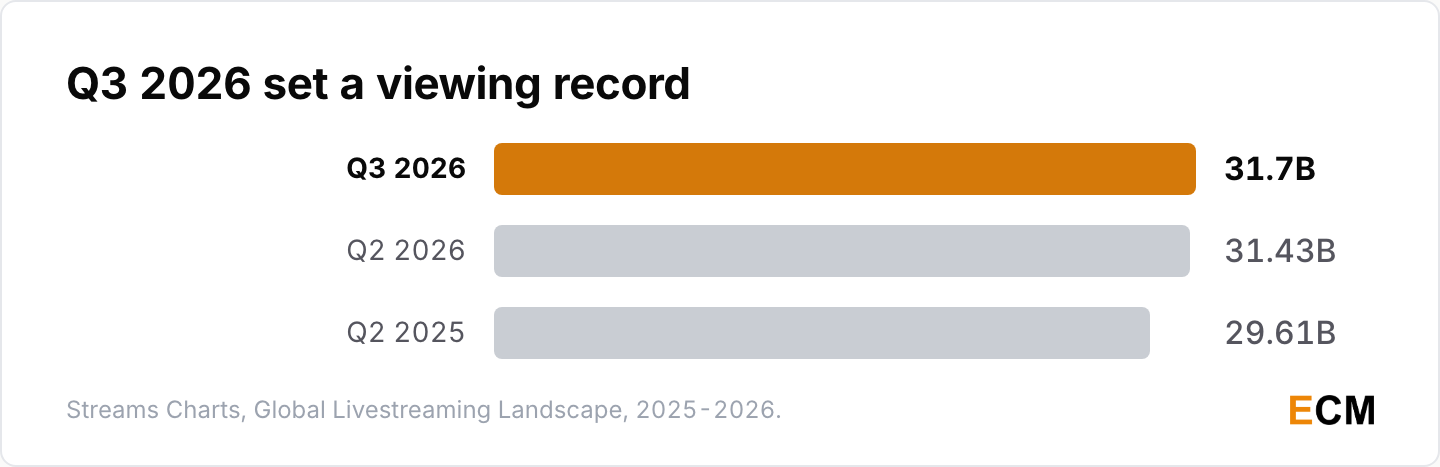
- Platforms tracked by Streams Charts generated a record 31.7 billion hours watched in Q3 2026, up 0.8% on Q2 (Streams Charts, Q3 2026 Global Livestreaming Landscape, 2026).
- The same tracker counted 31.43 billion hours in Q2 2026, up 8% on Q1, and 29.61 billion hours in Q2 2025 (Streams Charts, Q2 2026 Global Livestreaming Landscape, 2026; Streams Charts, Q2 2025, 2025).
- Streamlabs and Hatchet counted 21.5 billion hours in Q2 2026, up 7.6% year over year, in their first report to include YouTube Live (Streamlabs and Hatchet, Q2 2026 report, 2026).
- Viewers watched 7.27 billion hours across all platforms in Q3 2022, and streamers broadcast 226 million hours (Streamlabs and Stream Hatchet, Q3 2022 report, 2022). By Q4 2025 the same partnership counted 20.90 billion hours watched and 318.8 million hours streamed, on a wider platform set (Streamlabs and Stream Hatchet, Q4 2025 report, 2026).
How Many People Watch Live Streams?
Live streams reach about one internet user in four each week, far fewer than watch online video in general.
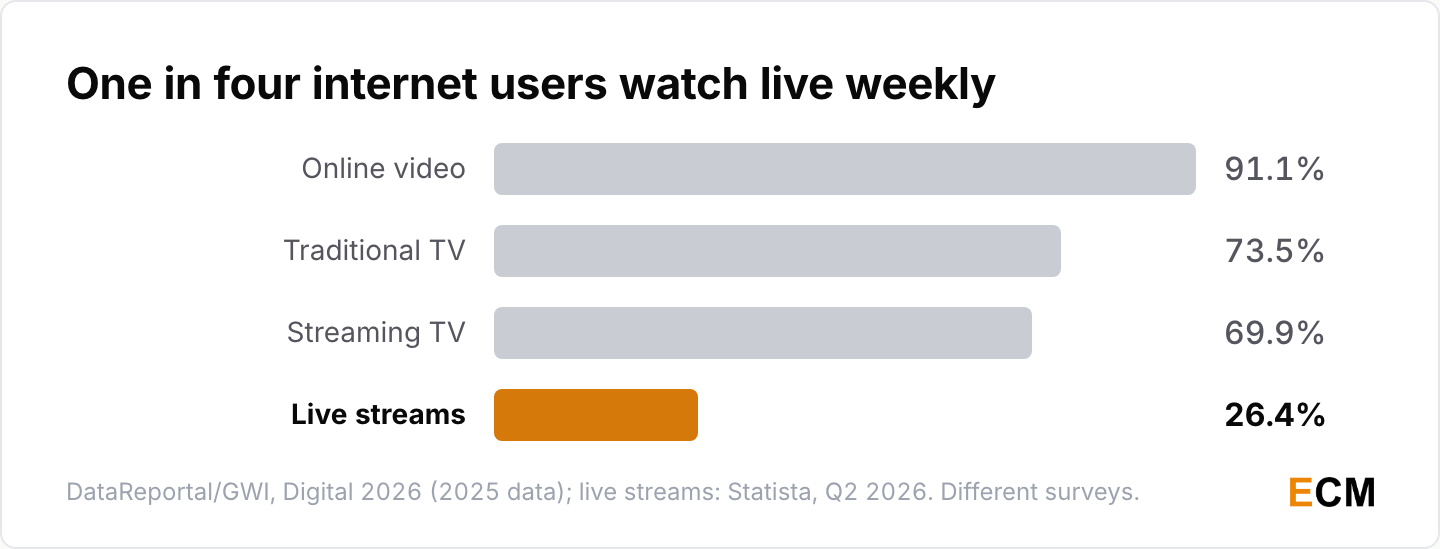
- Live streaming reached 26.4% of internet users worldwide each week in Q2 2026 (Statista, live streaming global reach, 2026). In Q2 2022, the reach was 29.5% (Statista, 2022).
- 91.1% of adult internet users watched online video in the past seven days, and 94.6% in the past 30 days (DataReportal, Digital 2026 Global Overview, 2025).
- 73.5% of connected adults watch traditional TV each week, against 69.9% who watch streaming TV platforms (DataReportal, Digital 2026, 2025).
- 91.7% of online adults consume streaming TV content each month (DataReportal, Digital 2026, 2025).
- Insider Intelligence forecast 163.4 million US live stream viewers by 2023 (Insider Intelligence, 2022).


Streaming Share of TV Viewing
Streaming now holds about half of US TV time, and YouTube is the single biggest distributor on the TV screen.
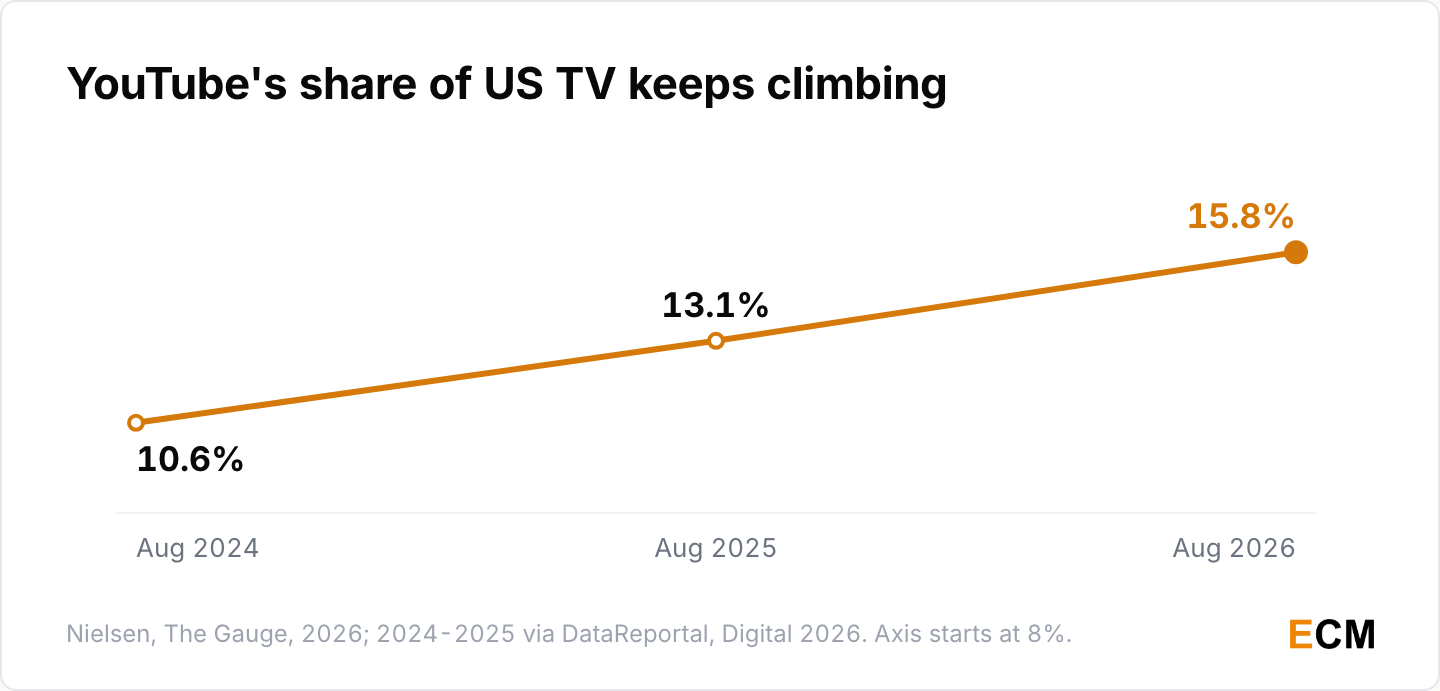
- Streaming captured 49.6% of US TV viewing in August 2026, and YouTube hit a record 15.8% (Nielsen, The Gauge August 2026, 2026). Netflix was third with 7.7% (Nielsen, 2026).
- YouTube’s share of US TV viewing time was 13.1% in August 2025, up from 10.6% in August 2024 (DataReportal, Digital 2026, citing Nielsen, 2025).
- OTT streaming accounts for 50.4% of internet users’ total TV watch time worldwide and 59.4% in the United States (DataReportal, Digital 2026, 2025).
- Big screens captured nearly 77% of streaming viewing hours worldwide in Q2 2022; in North America, Smart TVs and connected TV devices tied at 37.6% each (Conviva, State of Streaming Q2 2022, 2022). Globally, Roku held 30.5% of big-screen viewing, and Android TV viewing hours rose 81.9% year over year (Conviva, 2022).

Live Streaming Platform Market Share Statistics
YouTube leads on every tracker that counts it, Twitch was down year over year through Q2 2026, and Kick is the platform gaining fastest.
Which Live Streaming Platforms Are Most Popular?
On the Streamlabs and Hatchet count, YouTube Live alone holds three of every five hours watched.
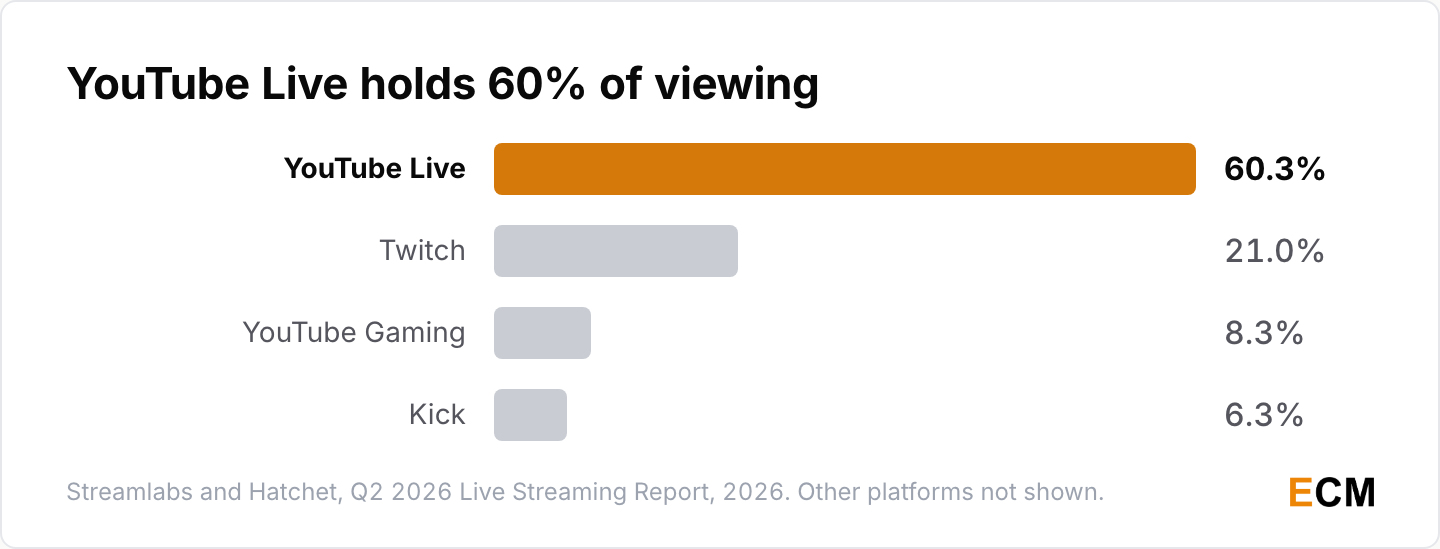
- YouTube Live accounted for 60.3% of hours watched in Q2 2026, up from 58.8% in Q1; Twitch had 21.0%, YouTube Gaming 8.3% and Kick 6.3% (Streamlabs and Hatchet, Q2 2026 report, 2026).
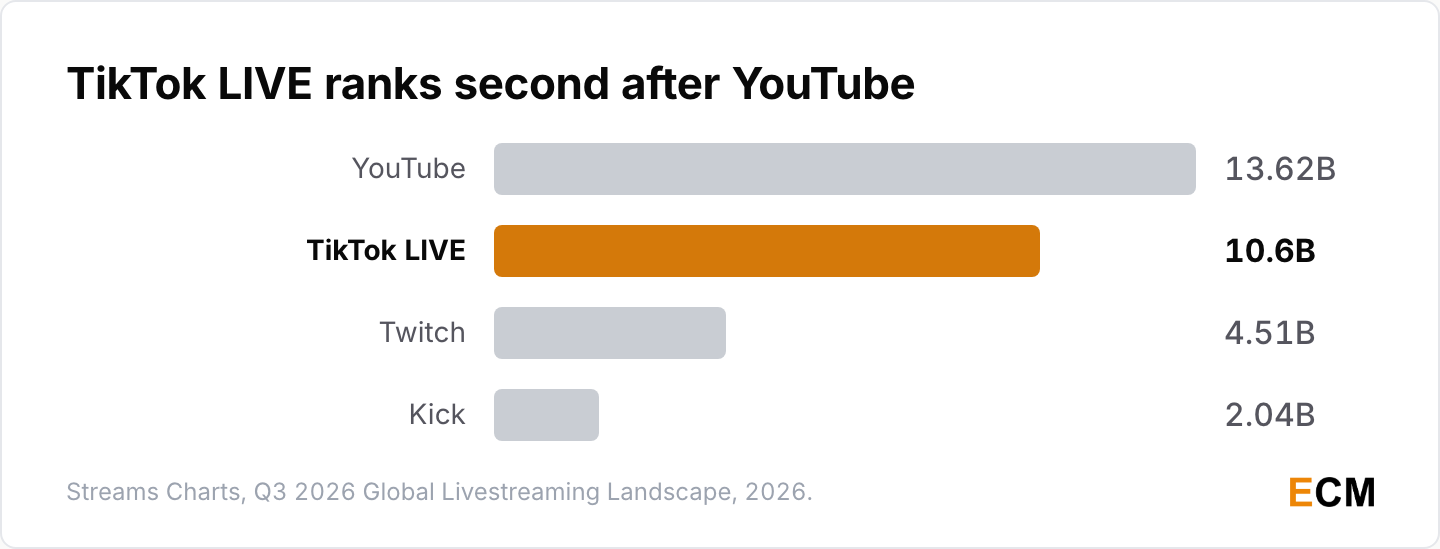
- Streams Charts counted 13.62 billion hours on YouTube in Q3 2026, 10.6 billion on TikTok LIVE, 4.51 billion on Twitch and 2.04 billion on Kick (Streams Charts, Q3 2026, 2026).
- Hatchet’s own Q2 2026 count, which adds TikTok Live but not YouTube Live, put total viewing at 17.5 billion hours, with TikTok Live at 8.9 billion hours and a 50.9% share (Hatchet, Q2 2026 Live Streaming Trends Report, 2026).
Twitch Viewership Statistics
Twitch is still the largest gaming-first platform, but its hours fell year over year through Q2 2026.
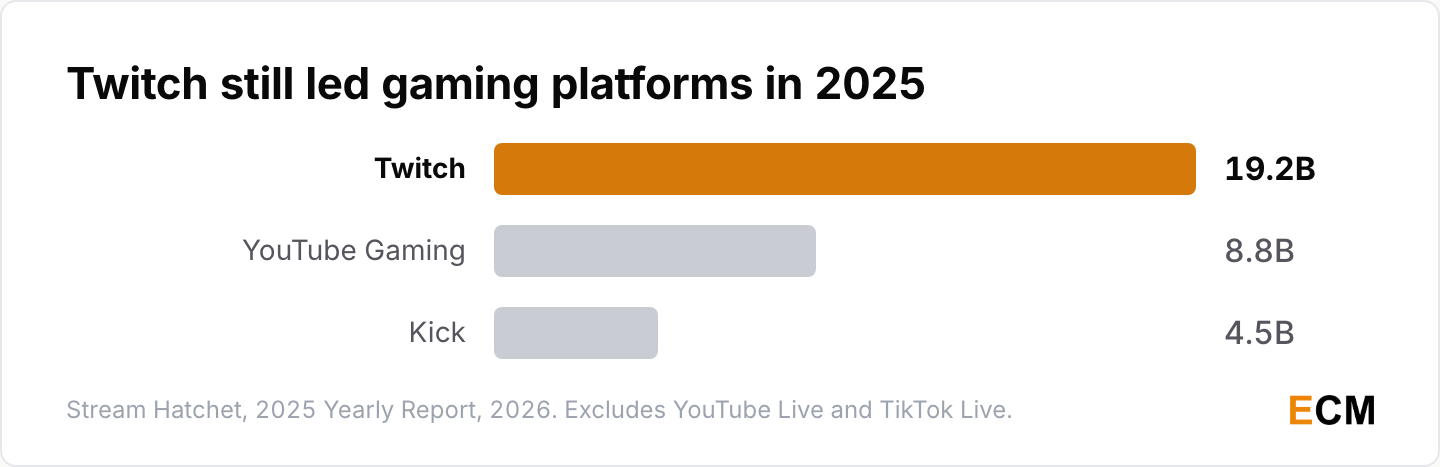
- Twitch led Stream Hatchet’s 2025 ranking, which leaves out YouTube Live and TikTok Live, with 19.2 billion hours watched, ahead of YouTube Gaming at 8.8 billion and Kick at 4.5 billion, while its share fell 8.3 points (Stream Hatchet, 2025 Yearly Report (PDF), 2026).
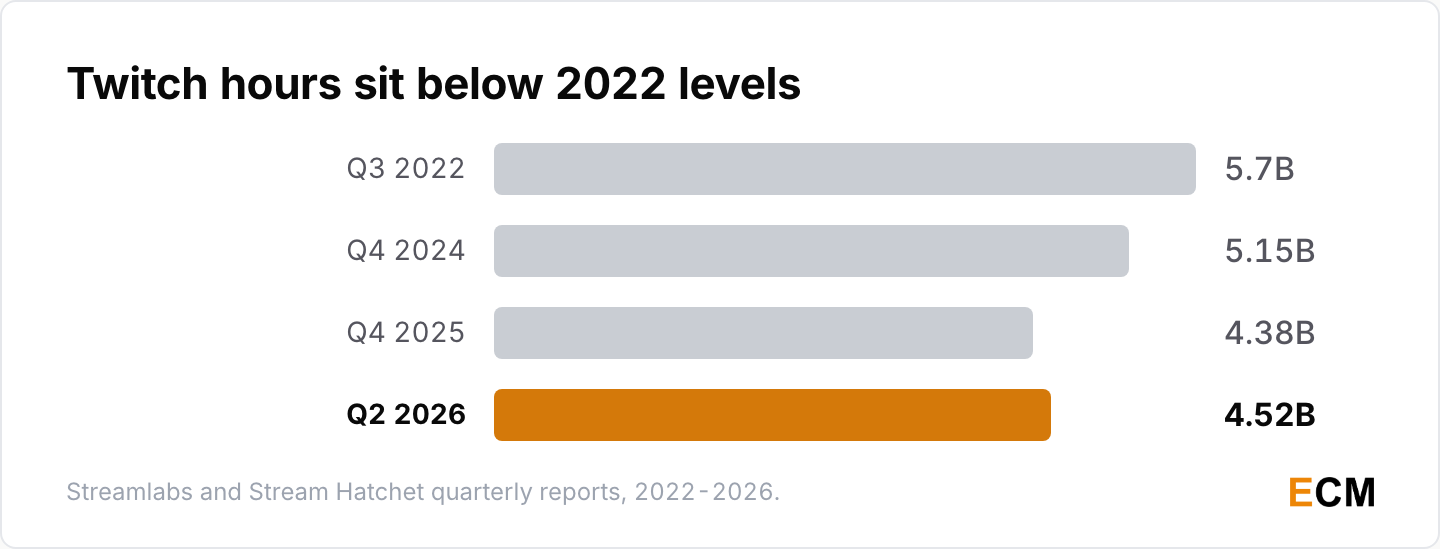
- Twitch drew 4.38 billion hours in Q4 2025, down 14.94% from 5.15 billion in Q4 2024, across 8.38 million unique channels (Streamlabs and Stream Hatchet, Q4 2025 report, 2026).
- Twitch hours fell 8.3% year over year to 4.52 billion in Q2 2026, with 7.94 million unique channels and 22.6 average viewers per channel (Streamlabs and Hatchet, Q2 2026 report, 2026).
- In Q3 2022, viewers watched 5.7 billion hours on Twitch and 1.176 billion hours on YouTube Gaming, where 443,000 unique channels streamed (Streamlabs and Stream Hatchet, Q3 2022 report, 2022).
- Stream Hatchet put Twitch’s live streaming market share at 72% in Q3 2022, and esports viewership was up 40% on Q3 2021 (Stream Hatchet, Q3 2022 report, 2022).

Kick and YouTube Gaming Growth
Kick grew year over year in 2025, Q4 2025 and Q2 2026, and YouTube Gaming had its best live year.
- Kick’s hours watched rose 131% in 2025 to 4.5 billion, and YouTube Gaming had its best live year with 8.8 billion hours (Stream Hatchet, 2025 Yearly Report, 2026).
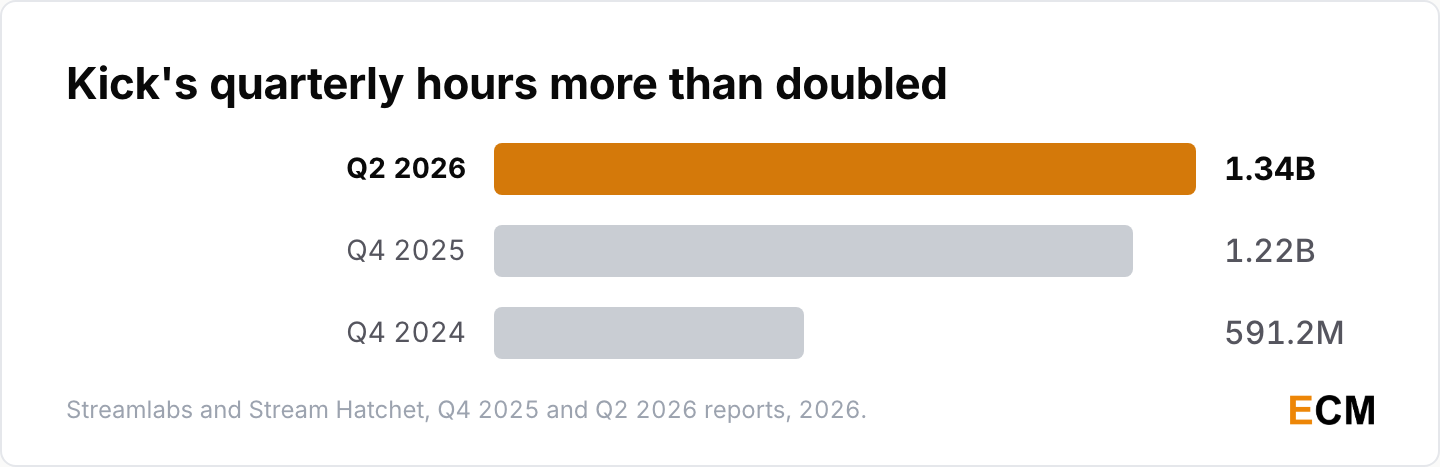
- Kick drew 591.2 million hours in Q4 2024 and 1.22 billion in Q4 2025 (Streamlabs and Stream Hatchet, Q4 2025 report, 2026), then 1.34 billion in Q2 2026, up 36.7% year over year, from 807,700 unique channels (Streamlabs and Hatchet, Q2 2026 report, 2026).
- Kick’s share of the hours Stream Hatchet tracked rose 6.7 points to 12.4% in 2025 (Stream Hatchet, 2025 Yearly Report (PDF), 2026).
- Streams Charts counted 2.04 billion Kick hours in Q3 2026, up 30.7% on the quarter and the platform’s third straight quarter of growth (Streams Charts, Q3 2026, 2026).
Live Streaming Audience and Content Statistics
Gaming still drives most live viewing, but non-gaming categories and one-off creator events pull the biggest crowds.
Most Popular Live Streaming Categories and Games
League of Legends and GTA V each pulled close to 2 billion hours in 2025.
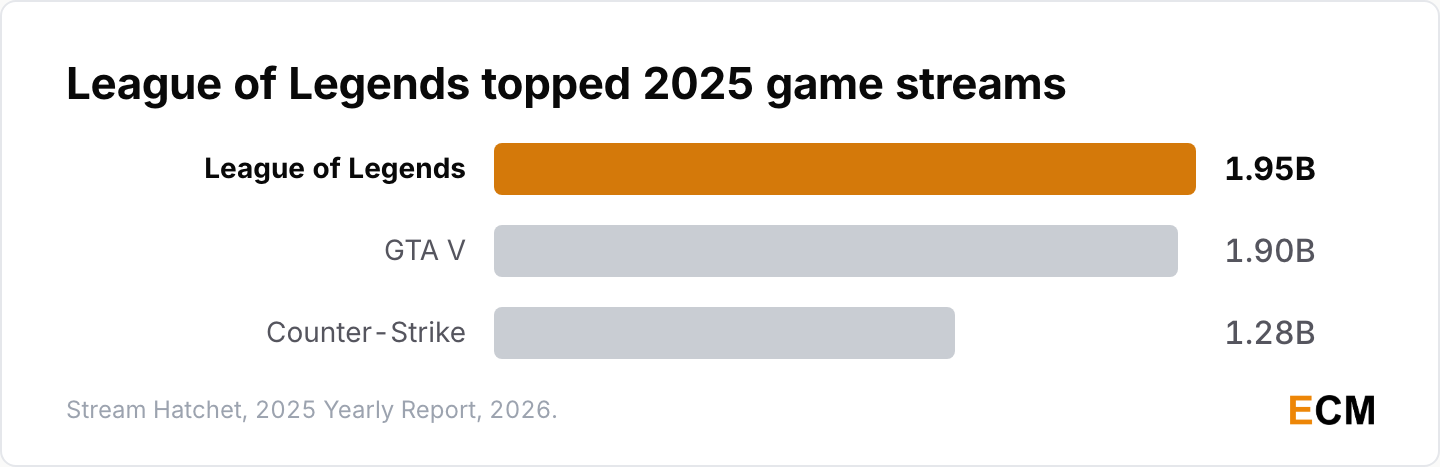
- League of Legends was the most-watched game on live streaming in 2025 with 1.95 billion hours, ahead of GTA V at 1.90 billion and Counter-Strike at 1.28 billion, while first-person shooters led all genres with 4.6 billion hours (Stream Hatchet, 2025 Yearly Report (PDF), 2026).
- Non-gaming content made up 22% of Twitch viewership in 2025, with Just Chatting up 25% and IRL up 19% (Stream Hatchet, 2026). Just Chatting was Twitch’s top category in Q2 2026 with 670.5 million hours (Streamlabs and Hatchet, Q2 2026 report, 2026), though gaming still made up 76.9% of Twitch watch time in Q3 2026 (Streams Charts, Q3 2026, 2026).
Esports and Top Streamer Records
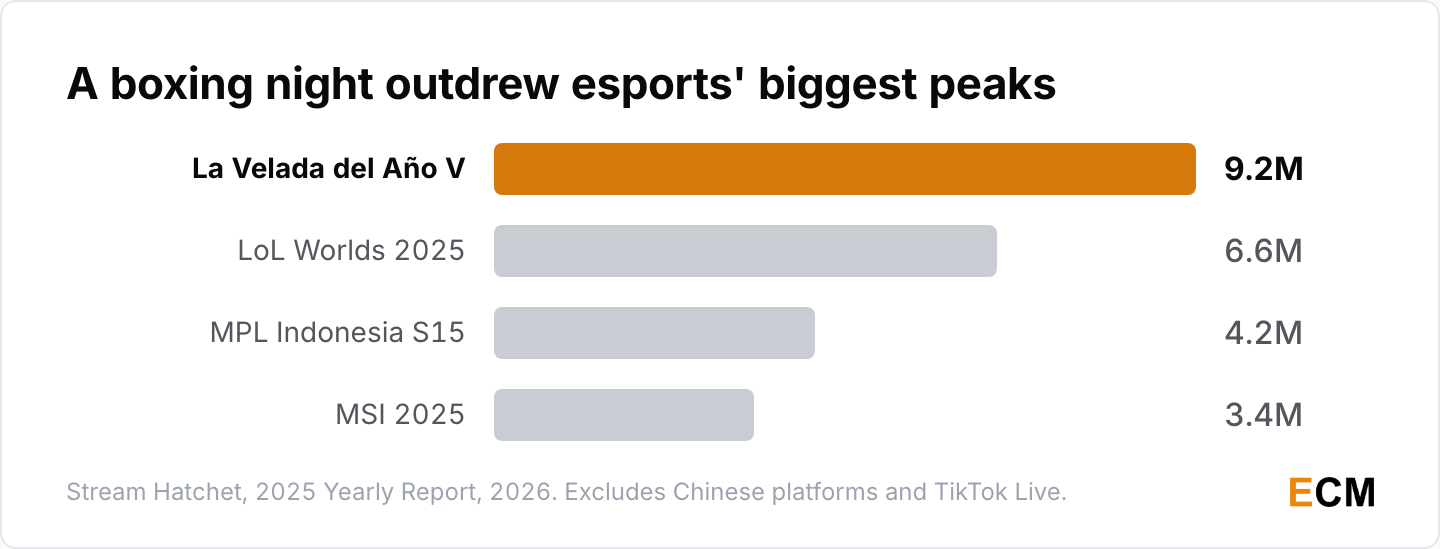
A creator-run boxing night outdrew every esports event Stream Hatchet counted in 2025.
- Esports viewing hit a record 2.8 billion hours in 2025, up 6%, and co-streamers accounted for half of that audience (Stream Hatchet, 2025 Yearly Report, 2026).
- League of Legends Worlds 2025 peaked at 6.6 million concurrent viewers, the biggest esports peak of the year outside Chinese platforms and TikTok Live, ahead of MPL Indonesia Season 15 at 4.2 million and MSI 2025 at 3.4 million (Stream Hatchet, 2025 Yearly Report (PDF), 2026).
- Ibai’s La Velada del Año V drew 9.2 million concurrent Twitch viewers in July 2025, the largest creator event of the year (Stream Hatchet, 2025 Yearly Report (PDF), 2026).
- Kai Cenat was the most-watched streamer of 2025 with 131.9 million hours, down 32%, followed by Caedrel at 108.1 million and Gaules at 96.6 million (Stream Hatchet, 2025 Yearly Report (PDF), 2026).
Who Watches Twitch and Live Video?
Twitch’s audience skews young, and that has held for years.
- Nearly 70% of Twitch viewers are 18 to 34, the site averages 105 million monthly visitors, and the community watched over 1.3 trillion minutes in 2023 (Twitch Advertising, 2024). Its earlier audience page put nearly 75% of viewers between 16 and 34 (Twitch Advertising, 2022).
- Twitch’s earlier audience page reported 1.3 trillion minutes watched in 2021, 31 million average daily visitors and 8 million unique streamers each month (Twitch Advertising, 2022).
- 61% of 18- to 34-year-olds watched a live stream several times a week or more (Statista, 2022).

Live Sports Streaming Audiences
Live sports produce streaming’s biggest single audiences and its biggest traffic spikes.
- YouTube’s first exclusive NFL game drew a 19.7 million global average minute audience, including 18.5 million in the US by Nielsen’s count (YouTube Blog, 2025).
- Super Bowl LIX reached 171.8 million US viewers across FOX, FOX Deportes, Telemundo, Tubi and NFL digital properties (Nielsen, 2026).
- Live-streamed sports can make some applications triple or quadruple in usage and push network traffic up 30% to 40% (Sandvine, Global Internet Phenomena Report 2025, 2025).
- Video was about 76% of all mobile data traffic at the end of 2025 (Ericsson Mobility Report, 2026). Streaming video was 53.72% of overall internet traffic in the first half of 2021 (Sandvine, Global Internet Phenomena Report 2022, 2022).

Live Shopping and Live Stream Monetization Statistics
China shows how big live commerce can get. Western live shopping is growing from a much smaller base.
Live Commerce in China
Nearly three in four Chinese internet users watch live streams, and Shanghai alone sells tens of billions of dollars through them.
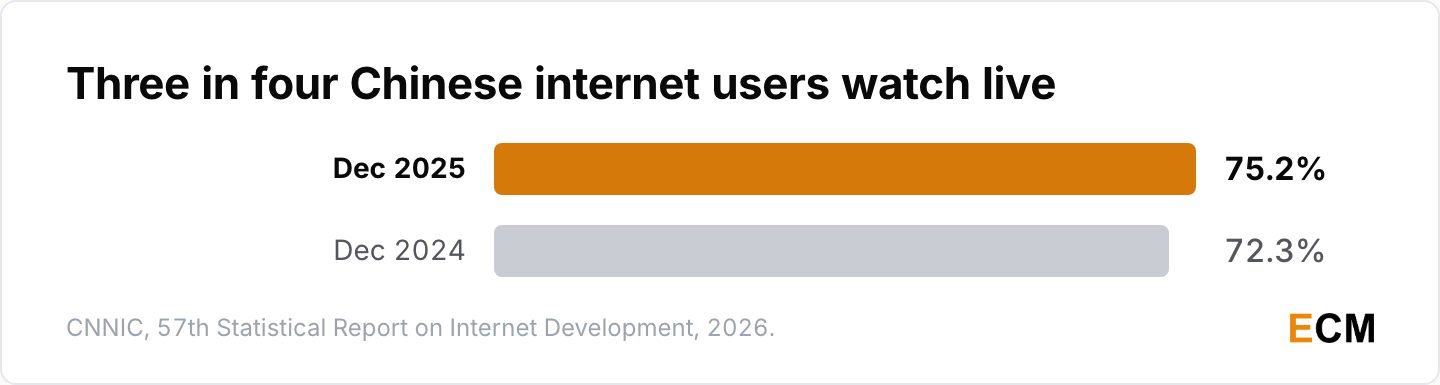
- China had 813.59 million online live streaming users in December 2025, 72.3% of its internet users, down from 833.03 million and 75.2% a year earlier (CNNIC, 57th Statistical Report on Internet Development, 2026).
- Shanghai recorded 493.7 billion yuan ($68.98 billion) in livestreaming retail sales in 2024, up 12.9% (Shanghai Municipal People’s Government, 2025).
- McKinsey reported that China’s live commerce market grew at more than 280% a year from 2017 to 2020 and estimated it at $171 billion in 2020; apparel and fashion made up 36% of live commerce, with beauty and food at about 7% each (McKinsey, 2021).

Live Shopping in the US and West
US live shopping is still a fraction of China’s, and the best-known Western results come from single brand events.
- Walmart’s 2021 live shopping event on TikTok drew seven times the views it expected and grew its TikTok following 25% (Influencer Marketing Hub, 2022).
- Mobile marketplace NTWRK hosted four US live shopping festivals that each passed 10 million views and produced 250,000 active buyers (Insider Intelligence, 2022).
- Statista put US livestream ecommerce sales at $5 billion in 2020 and projected $17 billion for 2022 and $55 billion for 2026 (Statista, 2022).

How Streamers and Creators Make Money
Platform payouts to creators now run into the tens of billions a year.
- YouTube has paid out over $100 billion to creators, artists and media companies globally over the last four years (YouTube Blog, Made on YouTube 2025, 2025).
- 60% of US streamers aged 18 to 34 had made money from streaming (Statista, 2022).
- Mid-tier influencers, with 500 to 5,000 average viewers, generated about 40% of live streaming hours on Twitch, YouTube Gaming and Facebook Gaming in Q3 2021 (Statista, 2022).


Live Streaming Statistics for Marketers and Brands
Live video still rates well with marketers, and in B2B the live webinar is where most of the attention goes.
How Marketers Rate Live Video
Live video was the second most effective social format in HubSpot’s 2022 survey, behind short-form video.
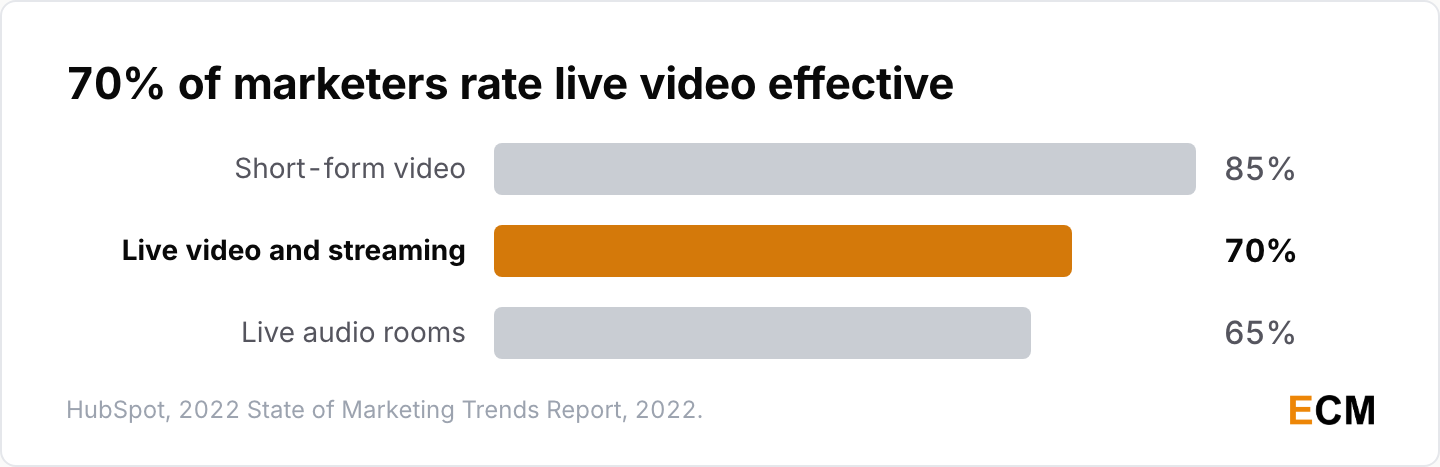
- 70% of marketers named live videos and streaming among the most effective social content formats, behind short-form video at 85% and ahead of live audio rooms at 65% (HubSpot, 2022 State of Marketing Trends, 2022). 37% of marketers planned to increase their investment in live video in 2022 (HubSpot, 2022).
- 26% of video marketers planned to include Facebook Live in their 2022 strategy, down 2 points on the year before (Wyzowl, Video Marketing Survey 2022, 2022).
- Livestream (Vimeo) said live video holds attention 10 to 20 times longer than on-demand content and drives 27% more minutes watched per view (Vimeo, Ultimate Guide to Livestreaming, 2020).
Webinar and B2B Live Event Statistics
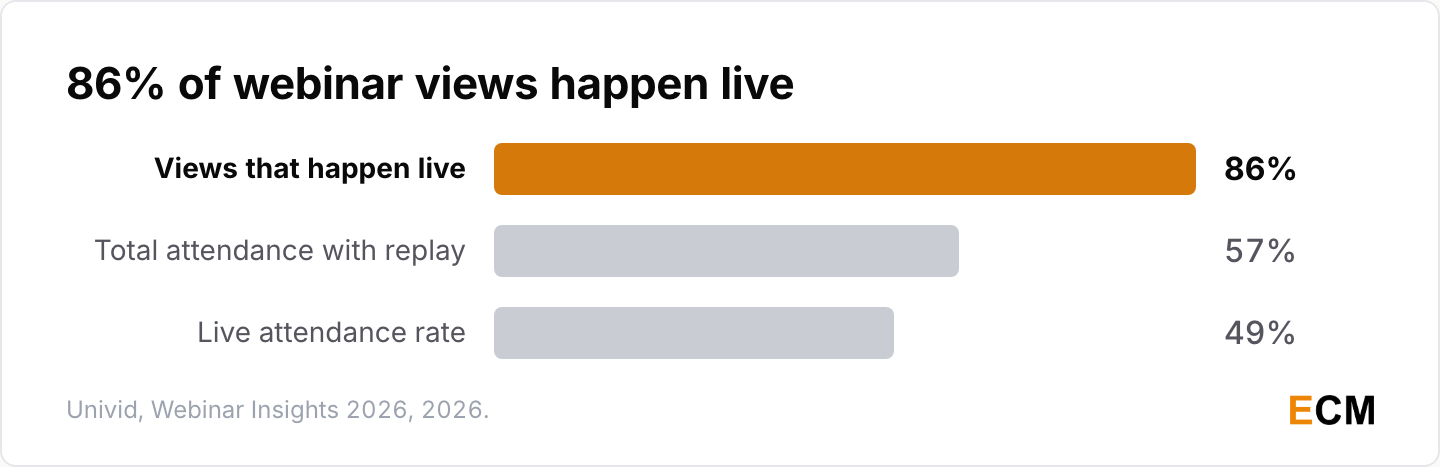
Most webinar attendees still join live, and they’re staying longer.
- 67% of webinar attendees joined live in 2025 and 43% watched on demand, and attendance rose 7%, with attendees staying an average of 51 minutes (ON24, 2026 Webinar Benchmarks Report, 2026).
- Webinars on Univid average a 49% live attendance rate and 57% total attendance with replays, and 86% of webinar views happen live (Univid, Webinar Insights 2026, 2026).
Brand Sponsorships on Twitch
Twitch viewers respond well to brands that back their streamers, and many of them are hard to reach elsewhere.
- Twitch’s 2022 advertising site reported that 84% of viewers said showing support for streamers is an important part of the Twitch experience, and 76% said they appreciate brands that help their favorite streamers succeed (Twitch Advertising, 2022).
- About 65% of US Twitch viewers can’t be reached on leading social channels, based on 2022 data (Twitch Advertising, 2025).
If you’re picking a tool to go live on several platforms at once, my reviews of StreamYard and Restream cover pricing and limits. For the wider picture, see my video marketing statistics, YouTube statistics and creator economy statistics.
Frequently Asked Questions
How big is the live streaming market?
Grand View Research valued the global live streaming market at $115.2 billion in 2025 and projects $658.7 billion by 2033 (Grand View Research, 2026). Market Research Future puts 2025 at $82.24 billion (Market Research Future, 2026). The two estimates differ by about $33 billion, so name the firm you quote.
How many people watch live streaming?
Live streams reached 26.4% of internet users worldwide each week in Q2 2026 (Statista, 2026). In China alone, 813.59 million people watched live streams in December 2025 (CNNIC, 2026).
How many hours of live streams were watched in Q3 2026?
Platforms tracked by Streams Charts generated a record 31.7 billion hours watched in Q3 2026 (Streams Charts, 2026).
Which live streaming platform is the most popular?
YouTube. YouTube Live took 60.3% of hours watched in Q2 2026, against 21.0% for Twitch and 6.3% for Kick (Streamlabs and Hatchet, 2026). Among gaming-first platforms, Twitch led 2025 with 19.2 billion hours (Stream Hatchet, 2025 Yearly Report (PDF), 2026).
Is live streaming still popular?
Yes. Stream Hatchet counted 36.4 billion hours watched in 2025, up 6% and close to the 2021 peak of 37.1 billion (Stream Hatchet, 2025 Yearly Report (PDF), 2026).
How much money do live streamers make?
Earnings depend on the platform. YouTube has paid creators, artists and media companies over $100 billion in four years (YouTube Blog, 2025).
How can brands use live streaming?
Webinars, live shopping and streamer sponsorships are the three routes with numbers behind them. 86% of webinar views happen live (Univid, 2026), and Shanghai alone sold 493.7 billion yuan through livestreams in 2024 (Shanghai Municipal People’s Government, 2025).
Written by
Editorial Staff
The Editorial Staff represents the writers, editors, and content creators who have worked (or work) at Elite Content Marketer. The experimenter-in-chief behind the team is Chintan Zalani, who has close to a decade of experience trying to make sense of the content marketing industry. Started in 2019, Elite Content Marketer is on a mission to help creators build sustainable businesses.
Related Articles

Marketing Data
Career Change Statistics 2026: 59 Facts That Matter
59 career change statistics for 2026: how often people switch careers, why they do it, the average age, what it pays and what stops them.
Nov 9, 2026Read more →

Marketing Data
EdTech Market Statistics 2026: 60 Funding and AI Facts
60 edtech market statistics for 2026: market size, venture funding, Duolingo and Coursera results, school device use, AI adoption and cybersecurity data.
Nov 3, 2026Read more →
Marketing Data
Branding Statistics 2026: 60 Facts You Need to Know
60 branding statistics for 2026: brand value rankings, trust and authenticity, user-generated content, social media, loyalty and B2B branding data.
Nov 2, 2026Read more →