More than 53% of all web traffic in 2025 came from bots rather than people, up from 51% the year before (Imperva 2026 Bad Bot Report). That is the headline among 2026 stats about websites, and it changes how I read every traffic figure.
Stats About Websites 2026: 60 Website Statistics
 Written by Editorial Staff
Key Takeaways
- Bots crossed the halfway line and kept going. Automated traffic passed 53% of the web in 2025 on Imperva’s measurement, up from 51% in 2024 (Imperva 2026 Bad Bot Report, 2026).
- The two big bot trackers disagree by 26 points, and both are defensible. Imperva says more than 53% (Imperva, 2026) while Statcounter puts bots at 27.3% of traffic in August 2026 (Statcounter, 2026).
- The web is smaller than “2 billion websites” suggests. Netcraft counts 1.49 billion hostnames but only 305 million domains and 14.8 million web-facing computers (Netcraft, July 2026).
- Blocking AI crawlers has a measured cost. Publishers that added robots.txt blocks lost about 7% of their traffic within six weeks (Zhao and Berman, 2025).
- Most Google searches never reach a website. 58.5% of US searches ended with zero clicks in 2024 (SparkToro and Datos, 2024), and 68.01% did in early 2026 on a different panel (SparkToro, 2026).
- Mobile and desktop are neck and neck. Statcounter had mobile at 49.36% and desktop at 49.11% of global pageviews in August 2026 (Statcounter, 2026).
Top Website Statistics for 2026
Five numbers carry the year, and the bot share is the one I would put first in any planning meeting.
Five Headline Website Statistics
The web keeps growing in hostnames and people, while a shrinking share of its traffic is human.
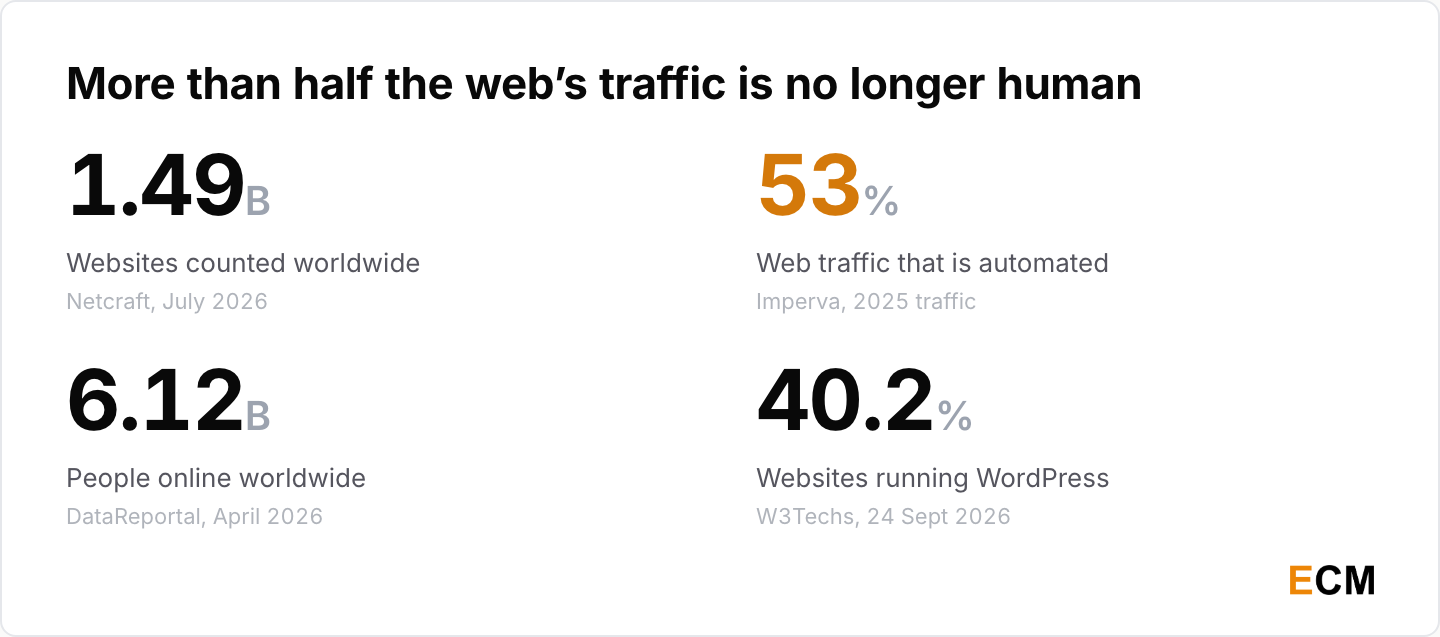
- Netcraft’s July 2026 Web Server Survey counted 1,494,915,628 sites, or 1.49 billion, across 305,348,459 domains and 14,772,048 web-facing computers (Netcraft, July 2026).
- Automated traffic accounted for more than 53% of all web traffic in 2025 against 47% human, up from 51% in 2024 (Imperva 2026 Bad Bot Report, 2026).
- 6.12 billion people were online in April 2026, 73.8% of the world population, up about 59 million year on year (DataReportal, April 2026).
- WordPress powers 40.2% of all websites and 58.8% of sites running a known CMS (W3Techs, retrieved 24 September 2026).
- 58.5% of US Google searches and 59.7% of EU searches ended with zero clicks, and only about 360 of every 1,000 US searches sent a click to the open web (SparkToro and Datos, 2024).
What Is the Most Visited Website?
Google, on every ranking I can find, and by a distance nobody else comes near.
- google.com ranks first in Similarweb’s list of the most visited websites, ahead of youtube.com at number 2, facebook.com at 3, instagram.com at 4 and chatgpt.com at 5 (Similarweb, September 2026), and Google ranked #1 in Cloudflare’s 2025 internet services ranking for the fourth year running (Cloudflare Radar, 2025).
- Google held 91.1% of global search engine market share across all devices in August 2026 (Statcounter, August 2026).
ChatGPT sitting fifth is the line I would underline. It is the only site in that top five that did not exist four years ago.
How Many Websites Are There in 2026
That question has three different right answers, and the distance between them is the point.
Websites, Domains and Web-Facing Computers
Netcraft’s 1.49 billion sites resolve to only 305 million domains on 14.8 million computers, so the domain count is the one I would quote (Netcraft, July 2026).
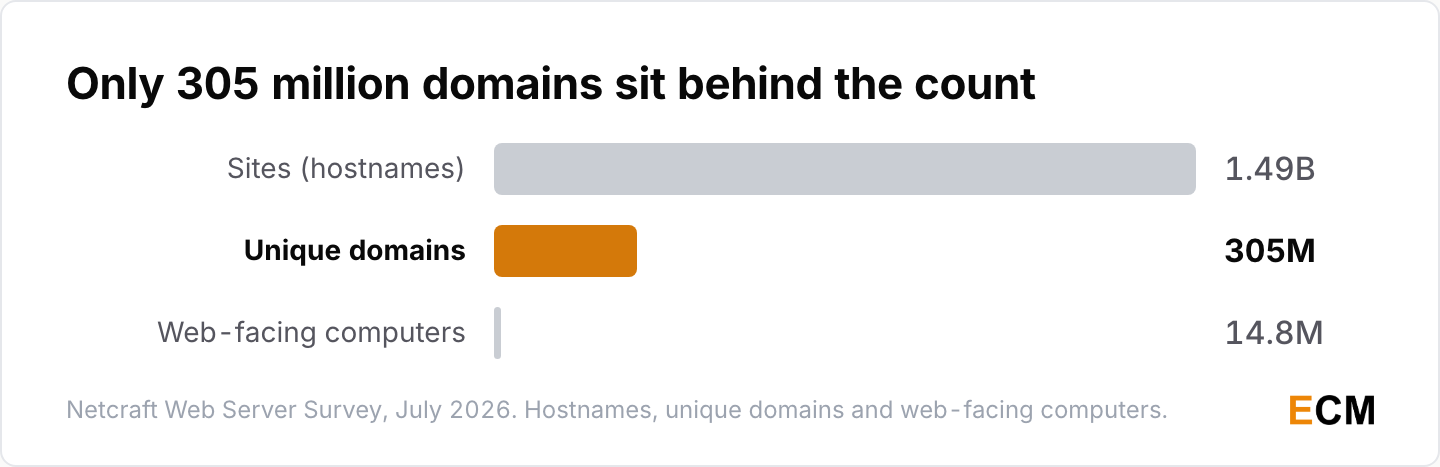
- In December 2025 the same survey counted 1,389,596,802 sites across 291,965,818 domains, so hostnames grew about 7.6% in seven months (Netcraft, December 2025).
- Domain registrations across all top-level domains reached 401.6 million at the end of Q2 2026, up 2.3% on the quarter and 8.1% year on year, from 386.9 million at the close of Q4 2025 (Verisign DNIB, 2026).
- The August 2026 Common Crawl archive holds 2.14 billion pages, a useful proxy for how much of the web a single crawler reaches in a month (Common Crawl, August 2026 archive, August 2026).
The “close to 2 billion websites” figure that has circulated for years comes from a real-time estimation counter, not a measurement. Hostnames are cheap and mostly parked. Web-facing computers tell you how concentrated the infrastructure has become.
Global Internet User Statistics
Growth in people online has slowed to about 1% a year, and the unconnected population is still larger than any single platform’s reach.
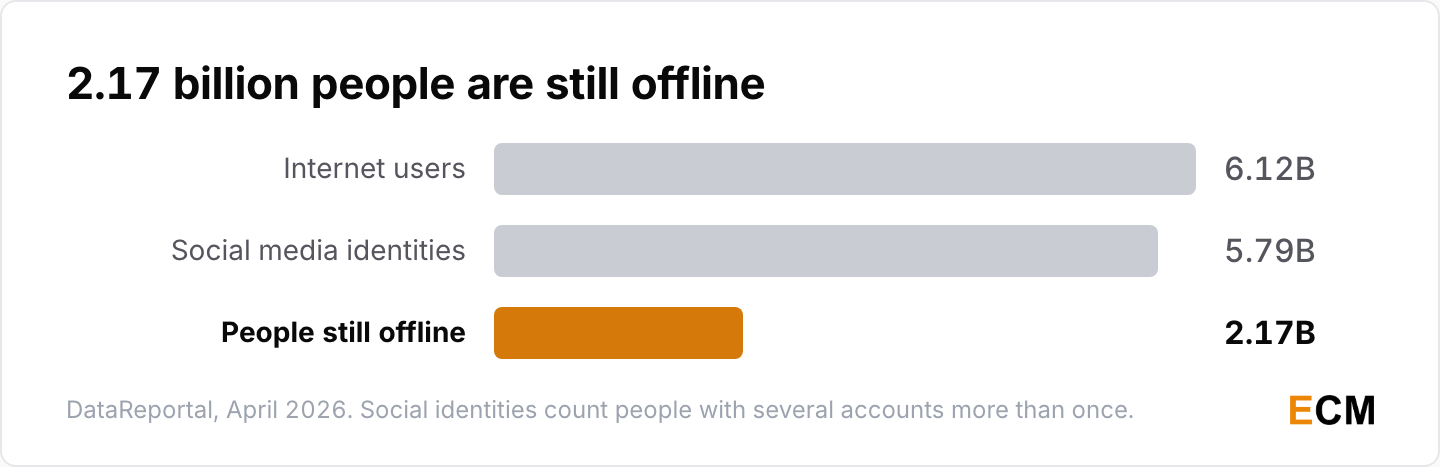
- 2.17 billion people remain unconnected, against 6.12 billion online (DataReportal, April 2026).
- 96.2% of internet users reach the web from a mobile phone at least some of the time (DataReportal, April 2026).
- Social media accounts total 5.79 billion user identities, or 69.9% of the world population, a count that includes people with more than one account (DataReportal, April 2026).
- Global internet traffic grew 19% year on year in 2025, and 52% of human traffic to Cloudflare is now post-quantum encrypted, up from 29% at the start of that year (Cloudflare, 2025).
Bot Traffic and AI Crawler Statistics
This is the section worth reading twice, because it decides what your analytics numbers mean.
Bot Traffic Statistics 2026
Machines now outnumber people on the web Imperva watches, and bad bots take a bigger share than good ones.
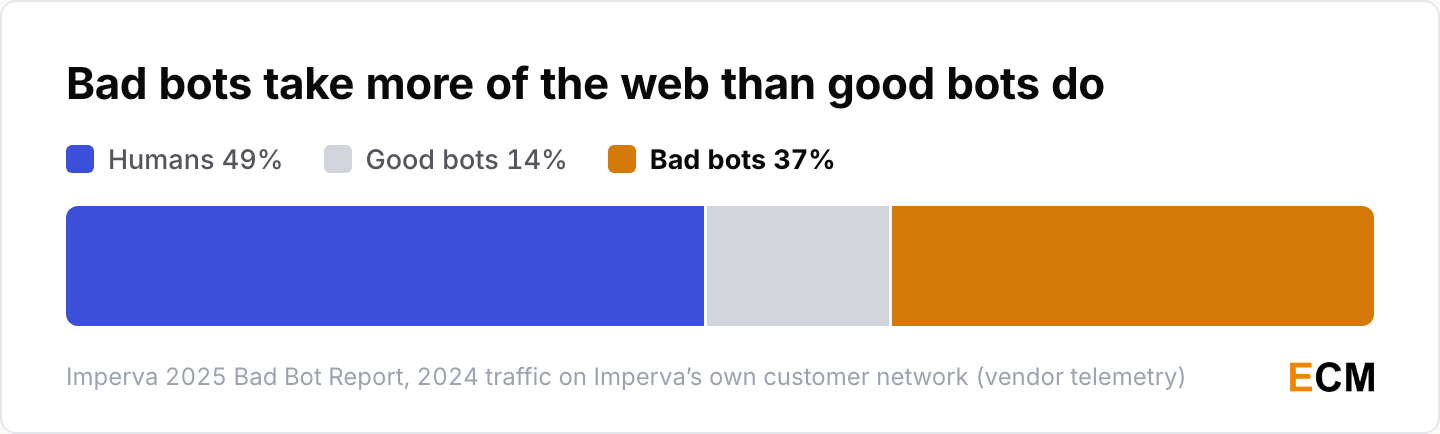
- In 2024 the split was 37% bad bots and 14% good bots against 49% human, the first year in a decade of Imperva’s tracking that automated traffic passed human traffic, with bad bots up from 32% in 2023 (Imperva 2025 Bad Bot Report, 2025).
- Simple bad-bot attacks climbed from 40% of all bot attacks in 2023 to 45% in 2024, which Imperva attributes to generative AI lowering the skill floor for attackers (Imperva, 2025).
Statcounter measures a very different web, and gets a very different answer.
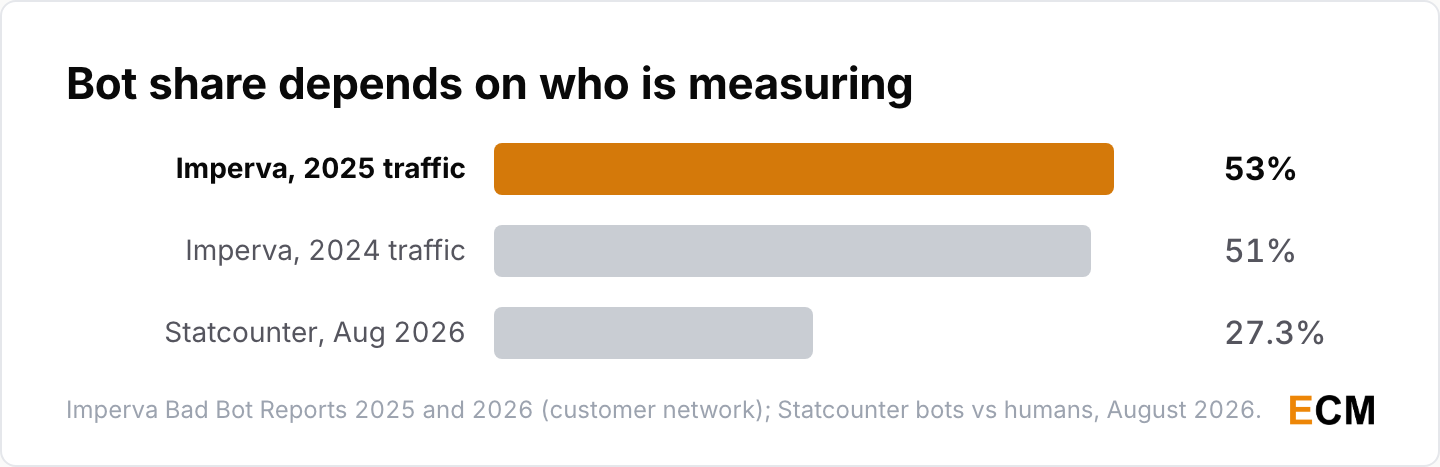
- Statcounter puts bots at 27.3% and humans at 72.7% of traffic worldwide in August 2026 (Statcounter, retrieved 24 September 2026).
- 27% of bot attacks targeted API endpoints in 2025, bypassing the user interface entirely (Imperva 2026 Bad Bot Report, 2026), after 44% of advanced bot traffic went to APIs against 10% to web applications in 2024 (Imperva 2025 Bad Bot Report, 2025).
- Travel overtook retail as the most-attacked industry with 27% of all bad-bot attacks, and 48% of all traffic to travel sites was bad bots (Imperva, 2025).
- Account takeover attacks grew 40% year on year, 14% of all login attempts were takeover attempts, and 31% of all attacks were OWASP-21 automated threats (Imperva, 2025).
Imperva watches enterprises that bought bot protection, exactly the sites bots hit hardest. Statcounter watches sites with a small analytics tracker, which skew smaller. The true figure for your site depends on which of those two you resemble.
AI Bots on Publisher Sites
AI bots went from about 5 visits per 1,000 human visits to about 32 within one year, reaching 20 by the second quarter.
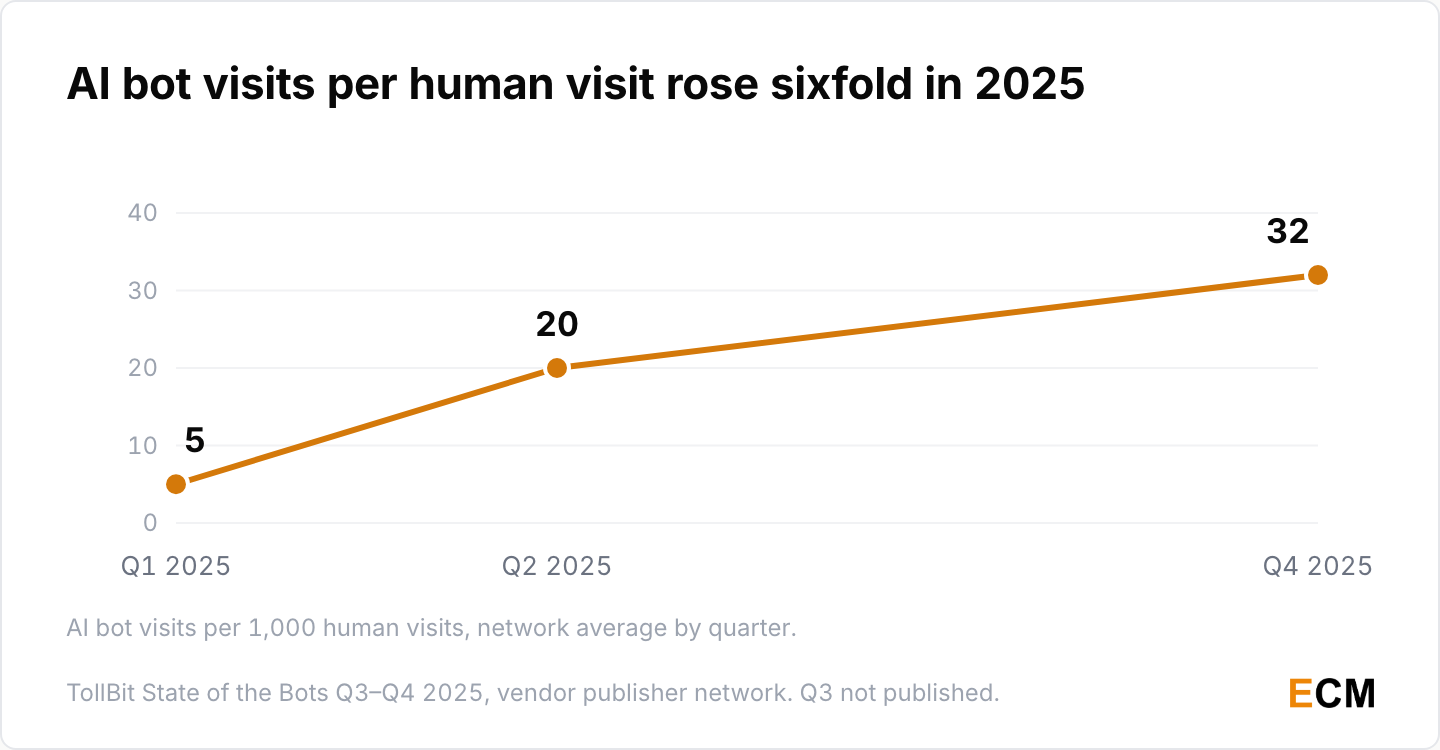
- On TollBit’s publisher network the ratio of AI bot visits to human visits went from 1 in 200 in Q1 2025 to 1 in 50 in Q2 and 1 in 31 by Q4, compound growth of 26% a quarter from Q2 to Q4 (TollBit, State of the Bots Q3 to Q4 2025, 2026).
- TollBit’s H1 2026 report switched to a regional split: the median North American site sees 1 AI bot visit per 93 human visits and the median European site 1 per 33, roughly 2.8 times the North American rate (TollBit, 2026).
The regional split is the more useful shape, and a warning about this series. Anyone citing “1 in 31” as a current global figure in late 2026 is quoting a number the publisher has moved on from.
Which AI Crawlers Take the Most
GPTBot more than tripled its share of crawler traffic in a year while ClaudeBot’s halved, the opposite of how the numbers usually get repeated.
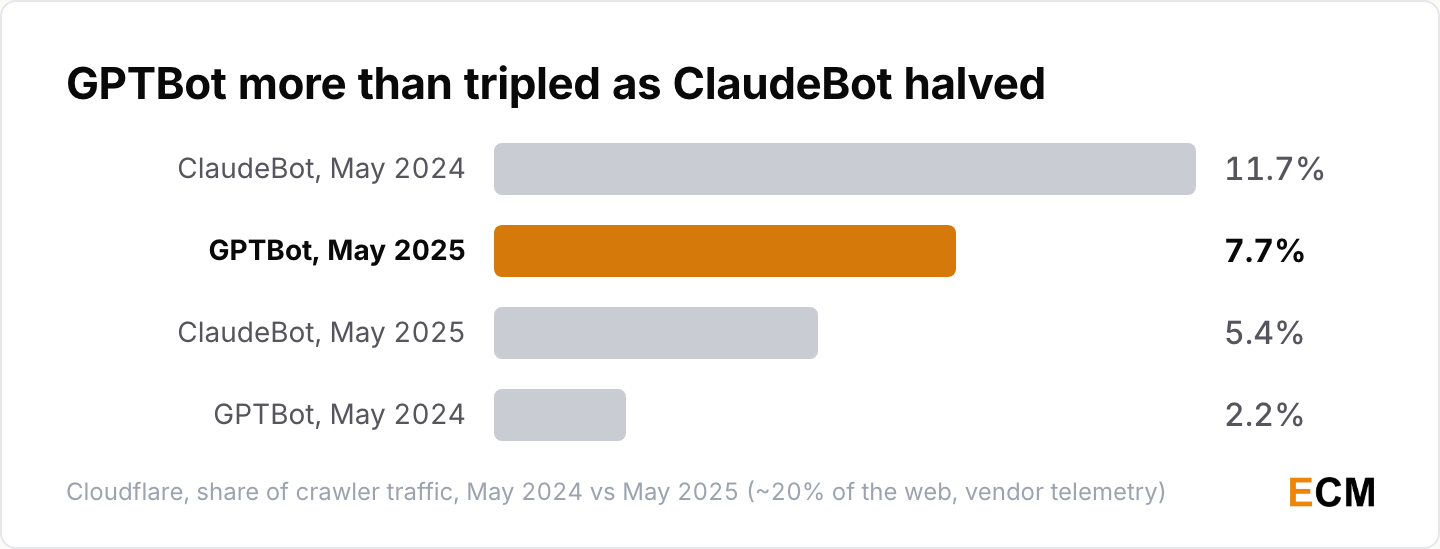
- GPTBot’s share of crawler traffic on Cloudflare’s network rose from 2.2% in May 2024 to 7.7% in May 2025, a 305% increase in raw requests, while ClaudeBot fell from 11.7% to 5.4%, a 46% decline (Cloudflare, 2025).
- Training accounts for close to 80% of all AI bot crawling, while user-triggered actions and undeclared purposes together account for less than 5% (Cloudflare, July 2025 data).
- Anthropic’s crawler made nearly 71,000 HTML page requests for every referral it sent back during the week of 19 to 26 June 2025 (Cloudflare, 2025).
- OpenAI documents 4 bots (GPTBot, ChatGPT-User, OAI-SearchBot and OAI-AdsBot) (OpenAI, 2026), Anthropic documents 3 (ClaudeBot, Claude-User and Claude-SearchBot) (Anthropic, 2026), and Google-Extended is a robots.txt token, not a crawler, that leaves Googlebot’s search crawl untouched (Google Search Central, 2026).
The 71,000-to-1 figure covers one week. Cloudflare publishes a live version of the ratio on its AI Insights dashboard, and it has moved a great deal since.
Blocking AI Crawlers and Traffic Cost
Blocking spread fast among big publishers, and the best evidence says it costs them traffic.
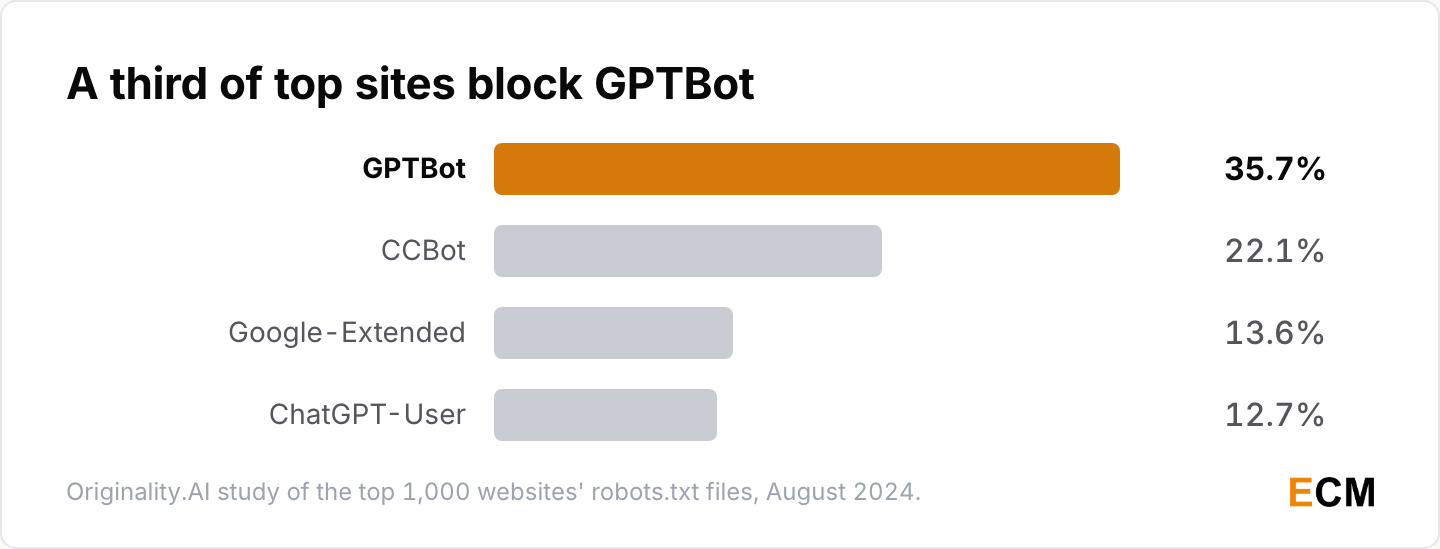
- 35.7% of the top 1,000 websites blocked GPTBot as of August 2024, up from 5% when GPTBot launched a year earlier; 22.1% blocked CCBot, 13.6% Google-Extended and 12.7% ChatGPT-User (Originality.AI, August 2024).
- 48% of top news websites across 10 countries blocked OpenAI’s crawlers by the end of 2023, from 79% in the United States down to 20% in Mexico and Poland, while 24% blocked Google-Extended, from 60% in Germany to 7% in Poland and Spain (Reuters Institute, 2024).
- From 1 July 2025, every new domain on Cloudflare starts with AI crawlers blocked by default, on a network that handles traffic for about 20% of the web (Cloudflare, 2025), and its pay-per-crawl option uses HTTP 402 Payment Required (Cloudflare, 2025).
- Publishers that blocked generative AI crawlers lost approximately 7% of traffic within six weeks, whether measured by SimilarWeb, Semrush or Comscore (Zhao and Berman, Strategic Response of News Publishers to Generative AI, 2025).
The 7% finding is the number I would put in front of anyone about to add a blanket AI block. It held across three independent panels, which is unusual, but it is still a working paper.
Website Traffic and Search Statistics
Search still sends most of the open web’s website traffic, and it is sending less of it every year.
Zero-Click Search Statistics
Six in ten Google searches ended without a click in 2024, and the newest panel data puts it closer to seven in ten.
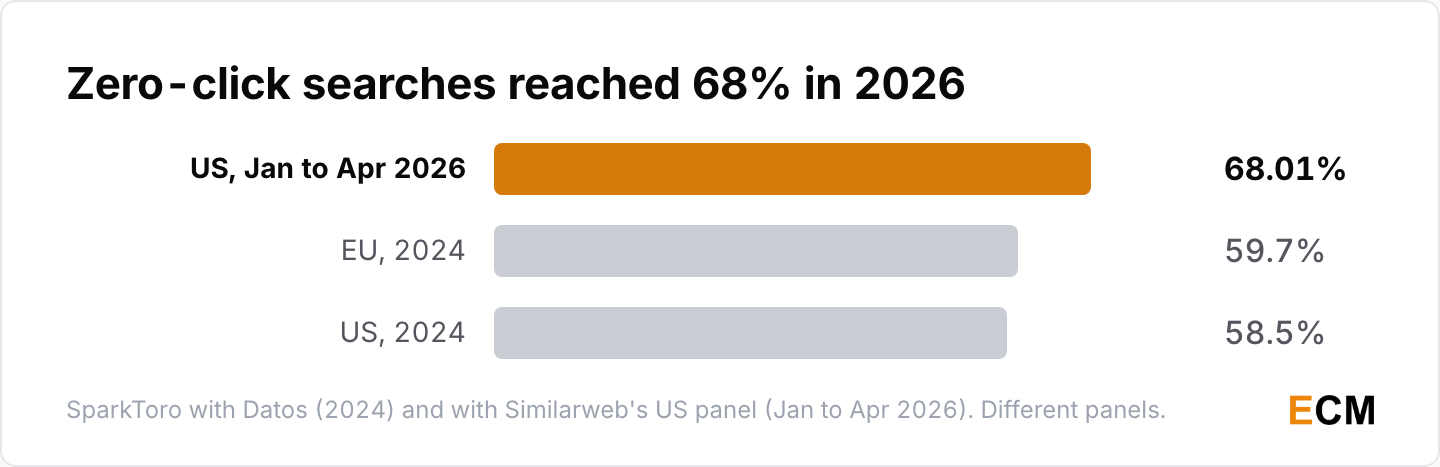
- For every 1,000 EU Google searches about 374 clicks reached the open web, against 360 in the US, where almost 30% of all clicks went to Google-owned properties like YouTube and Maps; about 22% of searches in both regions led straight to another search (SparkToro, 2024).
- SparkToro’s June 2026 follow-up, on Similarweb’s US panel, put zero-click searches at 68.01% of Google searches for January to April 2026 (SparkToro, 2026).
AI Overviews and Click-Through Rate
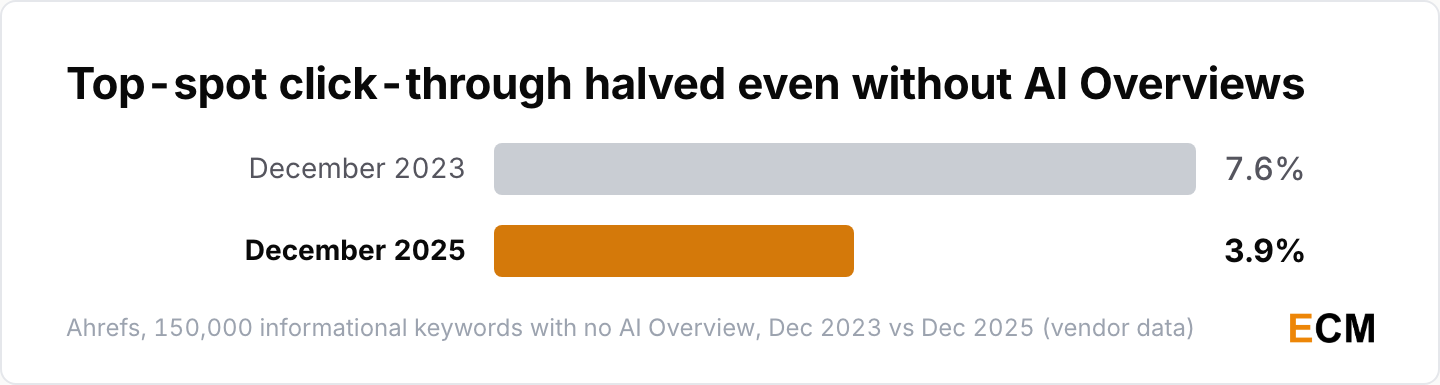
Top-ranking pages lost roughly half their clicks in two years, and more where an AI Overview sits above them.
- AI Overviews correlate with a 58% lower average click-through rate for the top-ranking page across 150,000 keywords that carry one (Ahrefs, December 2025 data), up from a 34.5% gap in Ahrefs’ April 2025 version of the study (Ahrefs, 2025).
- Position-one CTR for informational keywords with no AI Overview fell from 7.6% (0.076) in December 2023 to 3.9% (0.039) in December 2025, while keywords with one fell from 0.073 to 0.016 (Ahrefs, 2025).
- About 9% of AI Overviews appear somewhere other than the top of the results page (Ahrefs, 2025), and AI Overview prevalence reached 13.14% of tracked queries in March 2025, up from 6.49% in January (Semrush, 2025).
What Wins Citations in AI Answers
Quotations, statistics and named sources are what AI answers reward, and keyword stuffing backfires.
- Generative engine optimization methods raised source visibility in AI answers by up to 40% in the KDD 2024 study that named the field, and adding quotations, adding statistics and citing sources landed in the 30 to 40% improvement range, and fluency edits in the 15 to 30% range (Aggarwal et al., arXiv:2311.09735, 2024).
- Keyword stuffing scored about 8% below baseline on the paper’s position-adjusted word count measure, across a 10,000-query benchmark tested on a 1,000-query split and a 200-query Perplexity sample (Aggarwal et al., 2024).
For the search side in more depth, the SEO statistics page covers it, and the content marketing statistics page covers what teams are publishing, and digital marketing statistics covers budgets and channels.
How Do I See the Stats of a Website?
For your own site, an analytics tag; for anyone else’s, a panel estimate. Most of the web runs one tool.
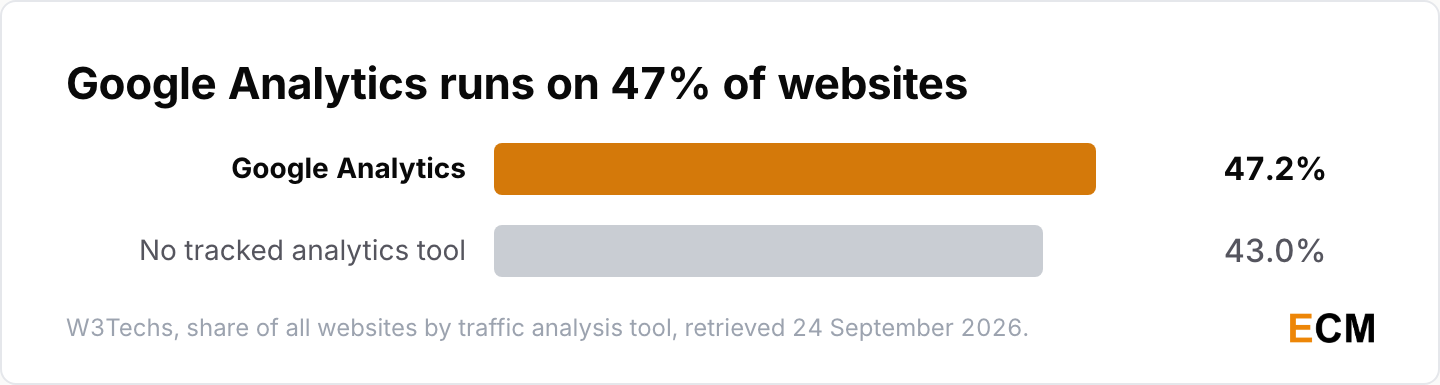
- Google Analytics runs on 47.2% of all websites, an 82.9% share of sites using any traffic analysis tool, while 43% of websites use none of the traffic analysis tools W3Techs monitors (W3Techs, retrieved 24 September 2026).
For a site you do not own, Similarweb and Semrush estimate traffic from panels, so treat their numbers as a direction, not a count.
Website Platform, CMS and Ecommerce Statistics
WordPress still dominates, but its share has been slipping for two years while the no-CMS web grows again.
CMS Market Share in 2026
WordPress runs four in ten websites, more than the next five systems combined.
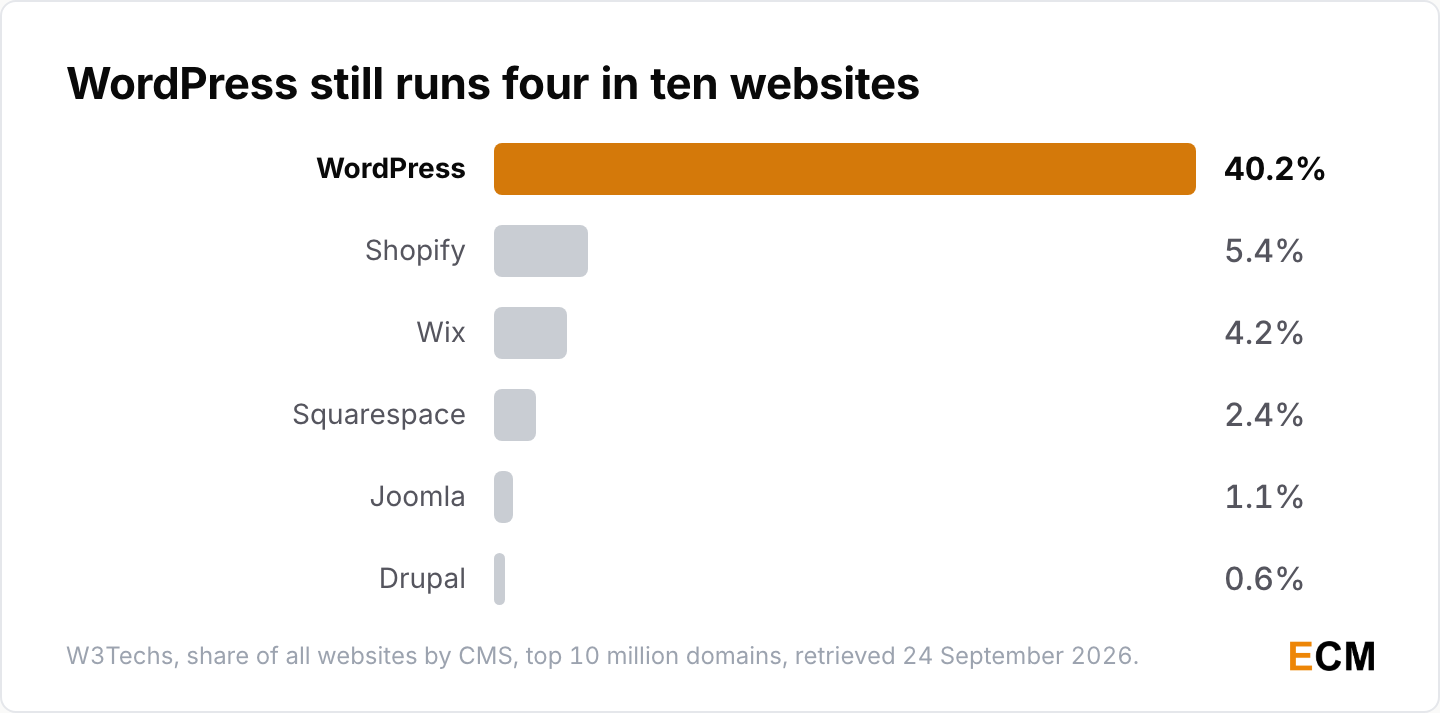
- WordPress’s 40.2% share is down from a 43.6% peak in W3Techs’ 1 January 2025 reading and 43.0% at the start of 2026 (W3Techs, retrieved 8 September 2026).
- Shopify is second at 5.4% of all websites and Wix third at 4.2%, with Squarespace at 2.4%, Joomla at 1.1% and Drupal at 0.6% (W3Techs, retrieved 24 September 2026).
- 31.5% of websites run no detectable CMS, a figure that ticked back up during 2026 after years of decline (W3Techs, retrieved 24 September 2026).
- HTTP Archive’s separate crawl puts CMS-powered sites at 55% of desktop and 54% of mobile, up from 42% and 43% in 2021, and records a WordPress dip of under one percentage point from its 2024 peak (Web Almanac 2025, 2025).
W3Techs scans the top 10 million domains; HTTP Archive crawls URLs that Chrome users visit. Different samples, same direction of travel.
Ecommerce Platforms and Online Sales
WooCommerce leads on store count and US online sales keep taking a bigger slice of retail each quarter.
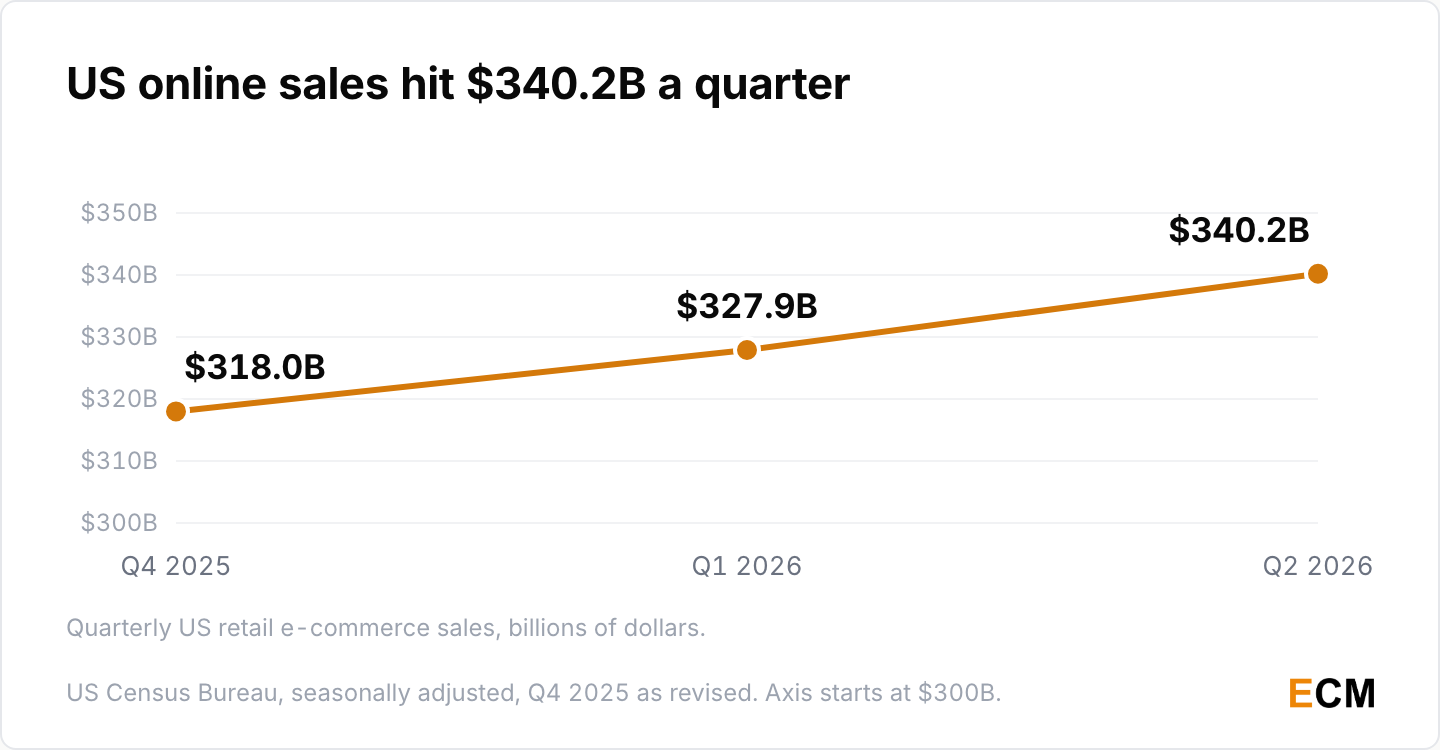
- US retail e-commerce sales reached $340.2 billion in Q2 2026, up 12.2% year on year, and 17.1% of total retail sales; Q1 2026 came in at $327.9 billion and 17.0% of retail, and Q4 2025 was revised to $318.0 billion and 16.7% (US Census Bureau, 2026).
- Store Leads tracks 13,822,296 active ecommerce stores: WooCommerce powers 4,053,656 of them, about 29.3%, and Shopify 3,100,790, about 22.4% (Store Leads, retrieved 24 September 2026).
- WooCommerce appears on 8.0% of all websites and accounts for 47.7% of the ecommerce systems W3Techs surveys (W3Techs, retrieved 24 September 2026).
- Global ecommerce consumer-goods spend was estimated at $3.66 trillion in 2025, up 13%, with the average shopper spending $1,127 a year (DataReportal, citing Statista, 2026).
- Wix reported 310 million users (Wix, 2026), and Squarespace has been private since Permira completed a take-private worth about $7.2 billion on 17 October 2024 (Squarespace, 2024).
Web Servers and Cloud Infrastructure
Cloud spending is growing at its fastest rate in eight years, Google Cloud is gaining share, and Cloudflare has just edged past nginx.
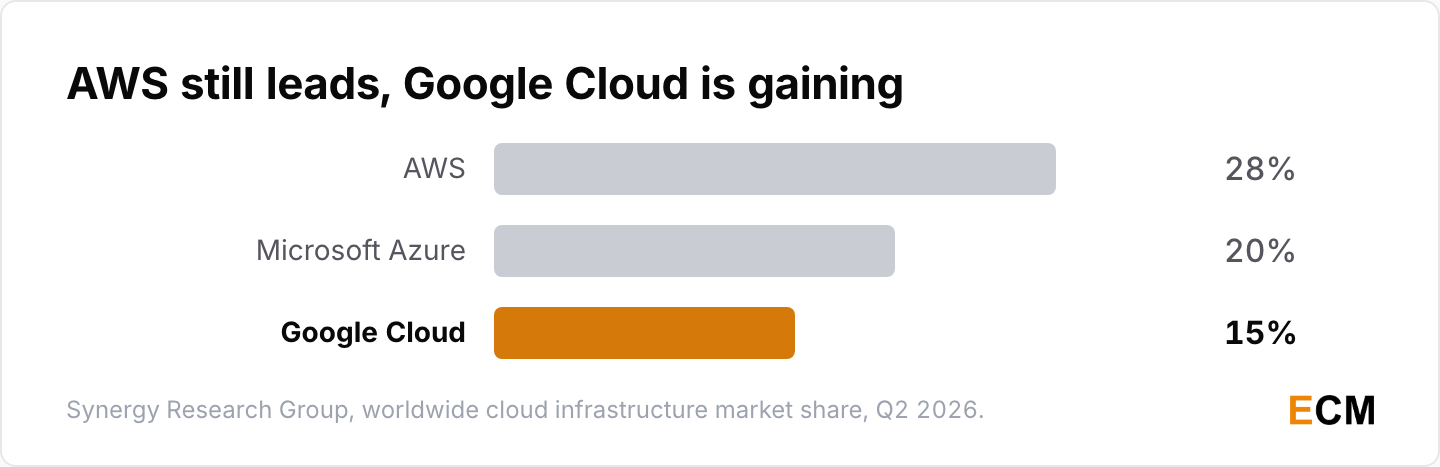
- The worldwide cloud infrastructure market reached $143.4 billion in Q2 2026, growing 43% year on year; AWS held 28%, Microsoft Azure 20% and Google Cloud 15%, a combined 63% (Synergy Research Group, 2026).
- Three quarters earlier the market was $106.9 billion with AWS at 29% and Google Cloud at 13% (Synergy Research Group, 2025).
- Cloudflare Server now runs 30.9% of the websites whose web server W3Techs can identify, a tenth of a point ahead of nginx at 30.8%, with Apache at 22.0% (W3Techs, retrieved 24 September 2026).
If you are picking where to put a site, the tools and hosting I use is a better starting point than market share.
Web Design and Accessibility Statistics
The most common web design failure is not visual taste or navigation. It is text that people cannot read.
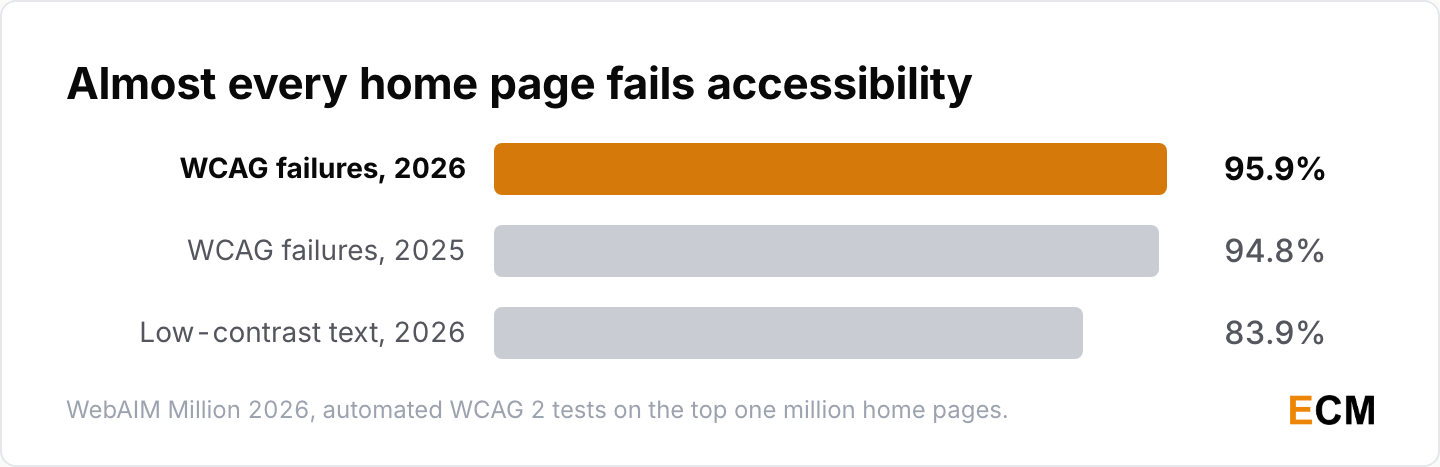
- 95.9% of the top one million home pages had detected WCAG 2 failures in 2026, up from 94.8% in 2025 (WebAIM Million, 2026).
- Home pages averaged 56.1 detected accessibility errors each, up 10.1% from 51 in 2025, and low-contrast text, the most common failure, appeared on 83.9% of them (WebAIM Million, 2026).
Website Speed, Load Time and Mobile Statistics
Loading speed benchmarks have not moved since 2024, and most mobile sites still miss at least one of them.
Core Web Vitals and Average Load Time
There is no single average load time worth quoting; the number that matters is whether the main content paints within 2.5 seconds.
- Interaction to Next Paint replaced First Input Delay as a Core Web Vital on 12 March 2024 (Google, 2024); the good thresholds are Largest Contentful Paint within 2.5 seconds, INP under 200 milliseconds and Cumulative Layout Shift under 0.1 (Google Search Central, 2026), measured at the 75th percentile of page loads (web.dev, 2026).
- 48% of mobile websites and 56% of desktop websites passed all three Core Web Vitals in 2025 (Web Almanac 2025, 2025).
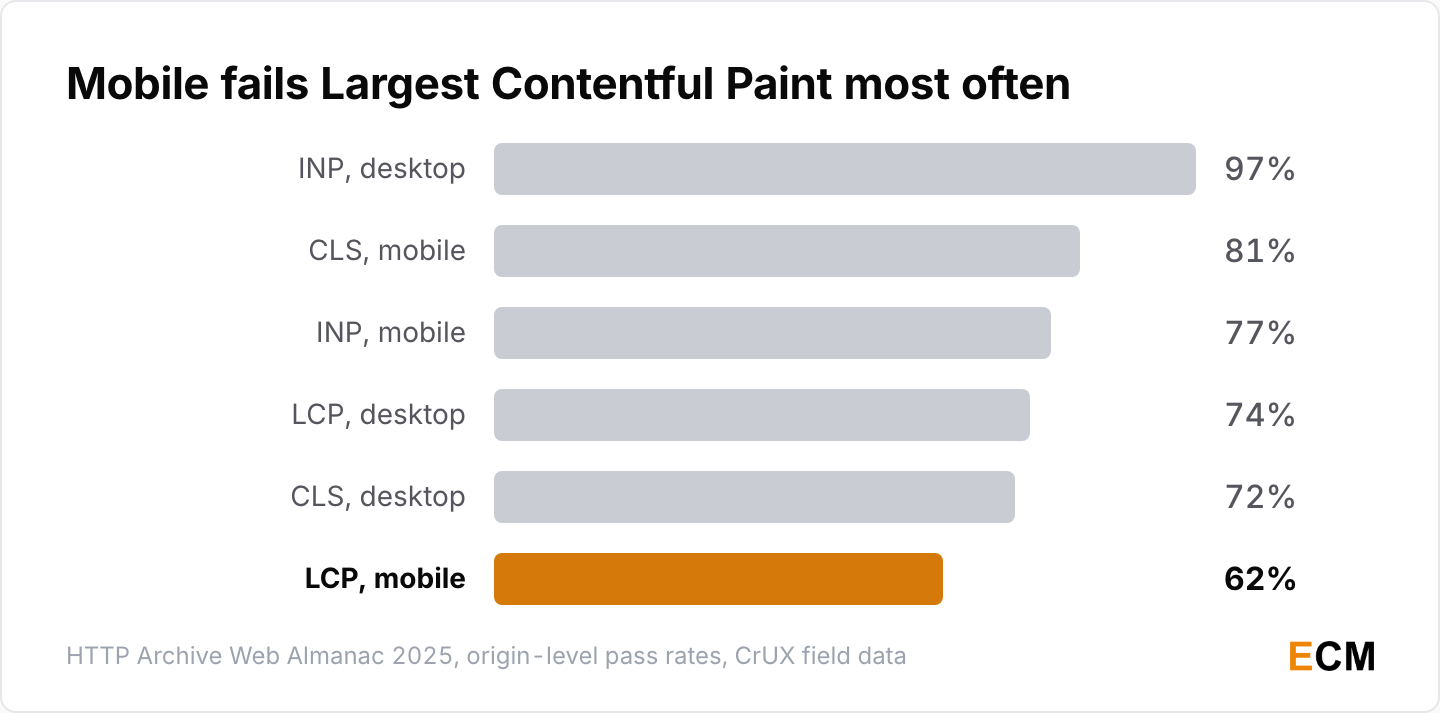
- LCP passes on 62% of mobile and 74% of desktop sites, CLS on 81% and 72%, and INP on 77% and 97% (Web Almanac 2025, 2025).
- 55% of desktop websites had a good time to first byte in 2025, up from 54% in 2024 (Web Almanac 2025, 2025).
Site Speed and Conversion Rates
Every “0.1 seconds equals more revenue” line traces back to one Google-commissioned study of 37 brands and 30 million sessions, and it is still the best evidence there is.
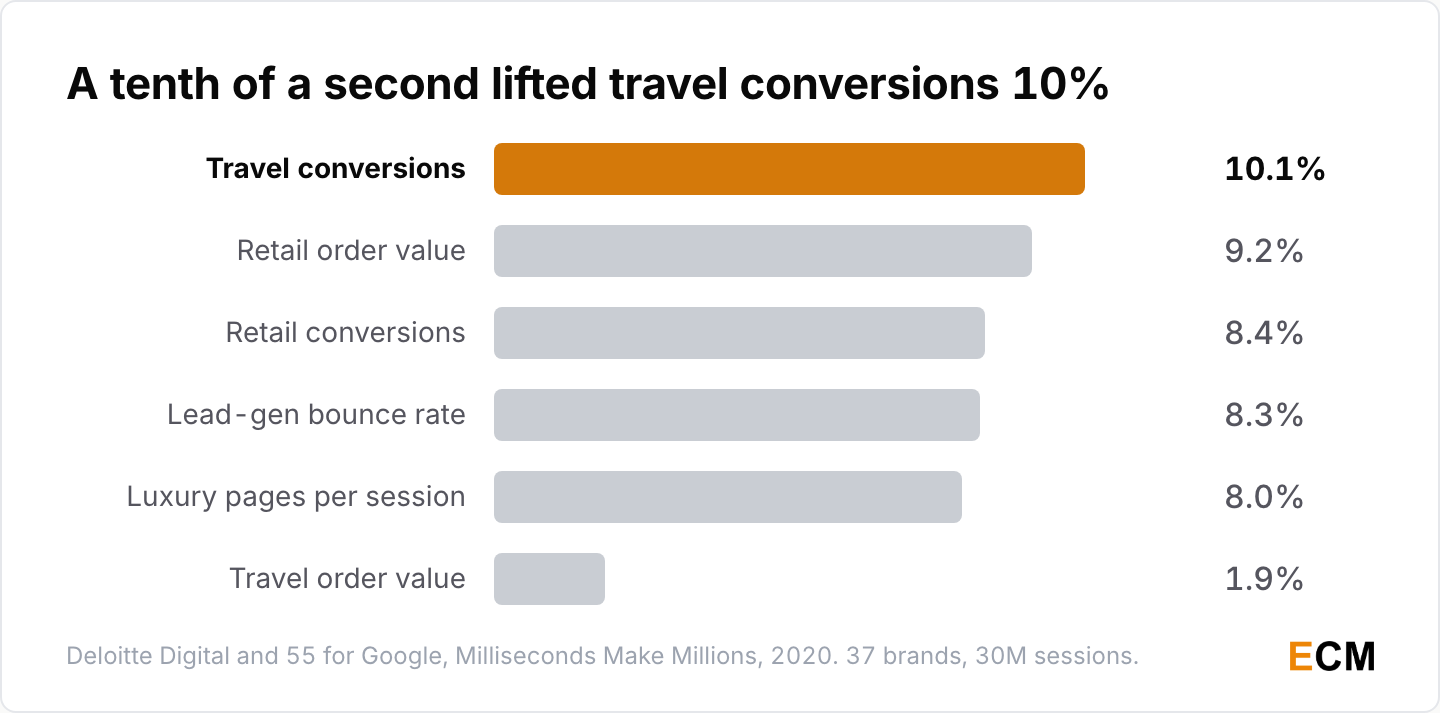
- A 0.1-second improvement in mobile site speed correlated with a 10.1% lift in travel conversions and an 8.4% lift in retail conversions (Deloitte Digital and Google, Milliseconds Make Millions, 2020).
- Retail average order value rose 9.2%, travel order value 1.9%, luxury page views per session 8.0%, and lead-generation bounce rate improved 8.3%, tracked over four weeks from 28 October to 24 November 2019 (Deloitte Digital and Google, 2020).
The research is six years old. The widely repeated 8.6% luxury figure is wrong: the report says 8.0%.
How Much Web Traffic Comes From Mobile?
About half, and the gap to desktop has closed faster than most planning decks assume.
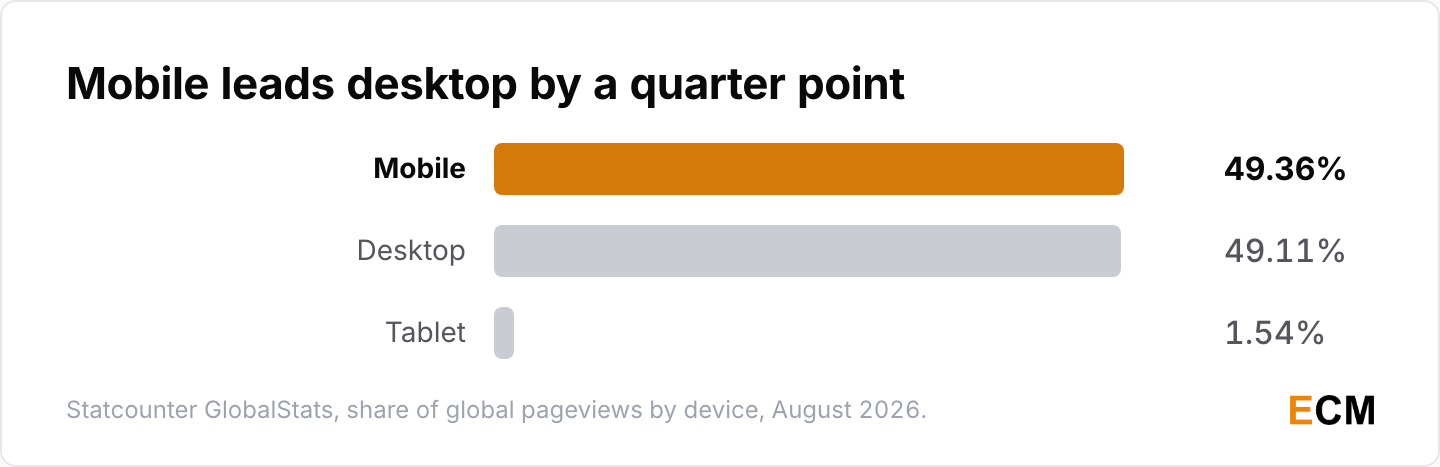
- Statcounter had mobile at 49.36%, desktop at 49.11% and tablet at 1.54% of global pageviews in August 2026 (Statcounter, retrieved 24 September 2026).
- Mobile accounted for 51.6% of total web traffic in DataReportal’s measurement (DataReportal, 2026).
Statcounter had mobile in the low sixties through the first half of 2025, and desktop first edged ahead in October 2025. Anyone quoting a mobile share this year should say which month and which tracker they mean.
Frequently Asked Questions
How Many Websites Are There in 2026?
It depends what you count. Netcraft’s July 2026 survey found 1,494,915,628 sites, but those resolve to only 305,348,459 domains and 14,772,048 web-facing computers (Netcraft). The “close to 2 billion websites” figure comes from a real-time estimation counter, not a measurement. The domain count is the number to use if you want something defensible.
What Is the #1 Most Visited Website?
Google. google.com ranks first in Similarweb’s most visited websites list, ahead of YouTube and Facebook (Similarweb, September 2026), and Google held 91.1% of global search engine share in August 2026 (Statcounter).
What Percentage of Website Traffic Is Bots?
Between 27% and 53%, depending on who is measuring. Imperva’s 2026 report puts automated traffic above 53% (Imperva); Statcounter puts bots at 27.3% (Statcounter, August 2026). Imperva watches sites that bought bot protection, the ones bots hit hardest. Statcounter watches smaller sites. They are measuring different webs.
What Are the Top 3 Website KPIs to Track?
I would track organic click-through rate, Core Web Vitals and human (not bot) sessions. Position-one CTR fell from 7.6% to 3.9% in two years (Ahrefs), only 48% of mobile sites pass all three vitals (Web Almanac 2025), and bots can be 53% of raw traffic (Imperva).
What Are the 7 C’s of a Website?
Context, content, community, customization, communication, connection and commerce: the 7 elements of Rayport and Jaworski’s 2001 customer-interface framework (ICEIS 2011 paper citing Rayport and Jaworski). It is still a useful checklist for what a site does for its visitors.
What Is the Average Load Time for a Website?
There is no reliable single average. Google’s target is Largest Contentful Paint within 2.5 seconds (Google Search Central), and 62% of mobile sites and 74% of desktop sites hit it (Web Almanac 2025).
What Percentage of Website Traffic Is Mobile?
Between 49% and 52% as of mid-2026. DataReportal reports mobile at 51.6% of web traffic (DataReportal); Statcounter had it at 49.36% of pageviews in August 2026, with desktop at 49.11% (Statcounter). Check the date on any mobile-share number you are handed.
Should I Block AI Crawlers on My Site?
The best evidence says blocking costs traffic. Zhao and Berman found publishers that added robots.txt blocks lost about 7% of visits within six weeks (Zhao and Berman). Weigh that against Anthropic’s crawler making nearly 71,000 page requests per referral in a week of June 2025 (Cloudflare). It is a business decision, not a technical one.
What Share of Websites Use WordPress?
40.2% of all websites and 58.8% of sites with a detectable CMS, per W3Techs on 24 September 2026, down from a 43.6% peak (W3Techs). The number counts technology presence, so abandoned installs are included.
Do Core Web Vitals Thresholds Still Apply in 2026?
Yes, unchanged: LCP within 2.5 seconds, INP under 200 milliseconds and CLS under 0.1 (Google Search Central), measured at the 75th percentile of page loads (web.dev). 48% of mobile and 56% of desktop websites pass all three (Web Almanac 2025).
Written by
Editorial Staff
The Editorial Staff represents the writers, editors, and content creators who have worked (or work) at Elite Content Marketer. The experimenter-in-chief behind the team is Chintan Zalani, who has close to a decade of experience trying to make sense of the content marketing industry. Started in 2019, Elite Content Marketer is on a mission to help creators build sustainable businesses.
Related Articles

Marketing Data
58 AI Personalization Statistics for 2026: ROI + Adoption
58 AI personalization statistics for 2026: 78% of marketers can’t make enough personalized content, and 87% of brands rate it good while 29% of consumers agree.
Oct 2, 2026Read more →
Marketing Data
60 AI Workflow Automation Statistics for 2026
60 AI workflow automation statistics for 2026: 37% of respondents see any EBIT impact from AI, 6% are high performers, and agents scale at big firms.
Oct 1, 2026Read more →
Marketing Data
AI Image Generation Statistics 2026: 60 Data Points
60 AI image generation statistics for 2026: people now create more than 3 billion images a week with ChatGPT Images and OpenAI’s API.
Sep 30, 2026Read more →