Artificial intelligence took 65.4% of every venture capital dollar deployed in the United States in 2025, $222.1 billion of $339.4 billion (PitchBook-NVCA Venture Monitor, Q4 2025). That’s the most concentrated figure in 2026’s investment statistics.
Investment Statistics 2026: 60 Data Points
 Written by Editorial Staff
Key Takeaways
- AI is no longer a sector of venture capital, it’s most of venture capital. 65.4% of US deal value in 2025 against 39.4% of deal count (PitchBook-NVCA, Q4 2025).
- The three biggest AI totals disagree by $15 billion, and all three are right. Crunchbase says $211B, PitchBook $222.1B, CB Insights $225.8B. They count different things, so always name which one you mean.
- Global capital flows recovered while the headline number stayed confusing. Foreign direct investment rose 6% to $1.6 trillion in 2025 (UNCTAD), but UNCTAD’s underlying measure had fallen 11% the year before.
- Three US technology companies have guided to between $545 billion and $570 billion of 2026 capital spending. Amazon alone expects about $220 billion (Amazon, July 2026).
- Retail money kept moving into ETFs at a record pace. US ETF net issuance hit $1.5 trillion in 2025, up from $598 billion two years earlier (ICI).
- Private markets had their second-best exit year on record. Buyout exit value reached $717 billion, up 47% (Bain), while global private equity deal value rose 19% to $2.6 trillion (McKinsey).
- US households now hold $49.1 trillion earmarked for retirement. That’s up 11% from $44.2 trillion a year earlier (ICI, Figure 8.5).
Top Investment Statistics for 2026
If you carry five numbers into a meeting, carry these.
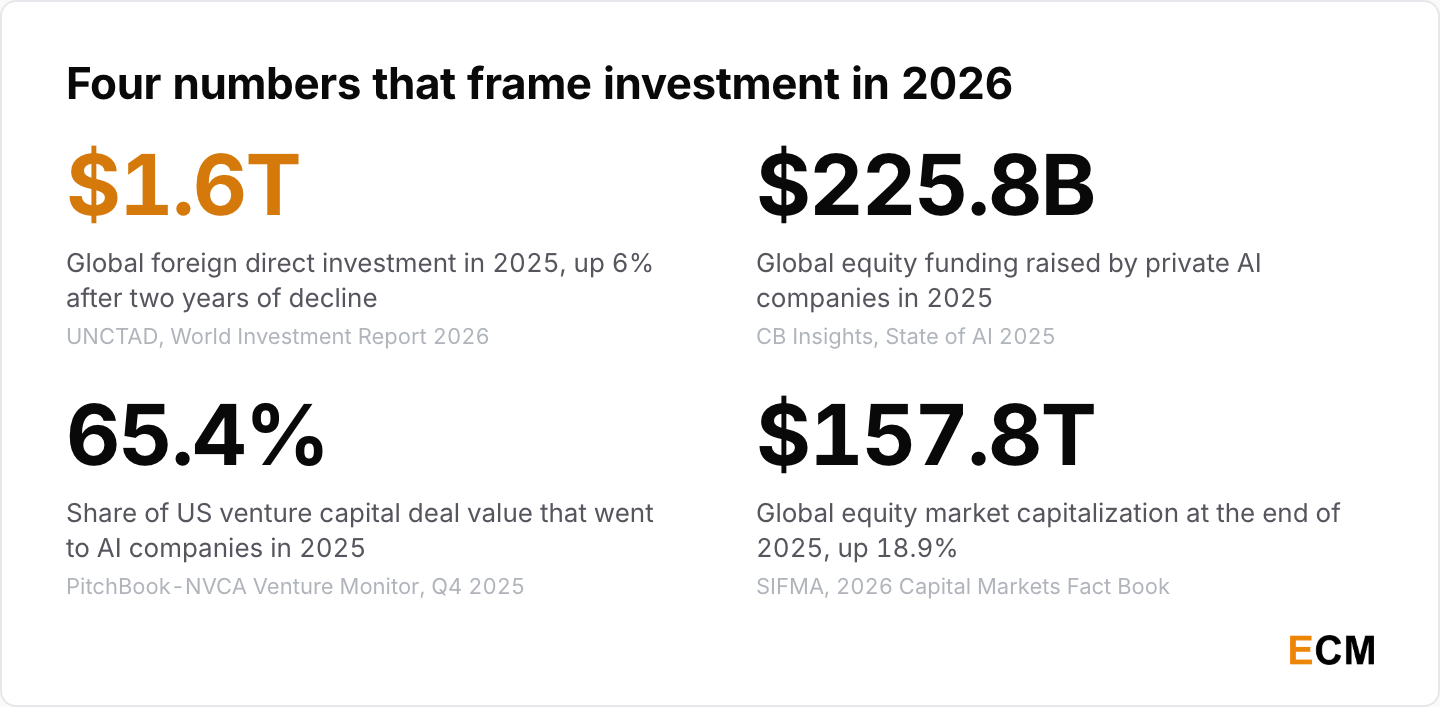
- Global foreign direct investment rose 6% to $1.6 trillion in 2025, ending two consecutive years of decline (UNCTAD, World Investment Report 2026, July 2026).
- Private AI companies raised a record $225.8 billion in global equity funding in 2025, close to double the 2024 total (CB Insights, State of AI 2025).
- AI accounted for 65.4% of all US venture capital deal value in 2025, $222.1 billion of $339.4 billion (PitchBook-NVCA Venture Monitor, Q4 2025).
- Global equity market capitalization rose 18.9% to $157.8 trillion at the end of 2025 (SIFMA, 2026 Capital Markets Fact Book).
- Net issuance of US ETF shares hit a record $1.5 trillion in 2025, up from $1.1 trillion in 2024 (ICI, 2026 Investment Company Fact Book, Figure 4.4).
Two of those five need a label attached when you quote them. The US venture share uses PitchBook’s definition of an AI company, and the ETF figure counts net issuance of shares rather than net inflows of cash.
Foreign Direct Investment Statistics by Country
This is the part of the field with real statistical infrastructure behind it. Governments have measured cross-border positions for decades under shared international standards, which is why the numbers reconcile and why the search results are dominated by statistical agencies rather than blogs.
Global FDI Flows in 2026
The headline recovered in 2025, and the measure sitting underneath it tells a gloomier story.
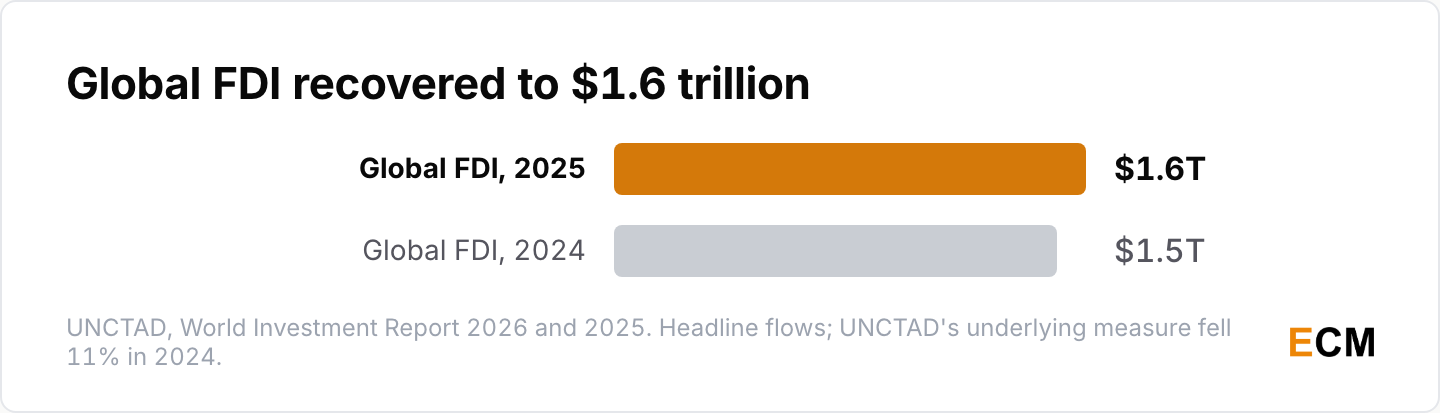
- Headline global FDI was $1.5 trillion in 2024, a 4% increase on 2023, while UNCTAD’s underlying measure, which strips out volatile conduit flows through a handful of European economies, fell 11% (UNCTAD, World Investment Report 2025).
- Global FDI flows reached $658 billion in the first quarter of 2026 on preliminary estimates, 44% above the previous quarter and 42% above the first quarter of 2025 (OECD, FDI in the first quarter of 2026, September 2026).
Those two UNCTAD measures are the most misquoted pair in this field. They are the reason you see “global FDI rose 4%” and “global FDI fell 11%” published in the same week about the same year.
One is the headline flow. The other strips out money that passes through Luxembourg and the Netherlands on its way somewhere else. Quote one without naming which, and you have said nothing.
Treat the quarterly number carefully too. It’s a single quarter, it’s preliminary, and quarterly FDI is volatile enough that a 44% move isn’t a trend.
US Positions Abroad and Inward
The stock of accumulated ownership runs in both directions, and Europe dominates the outbound side.
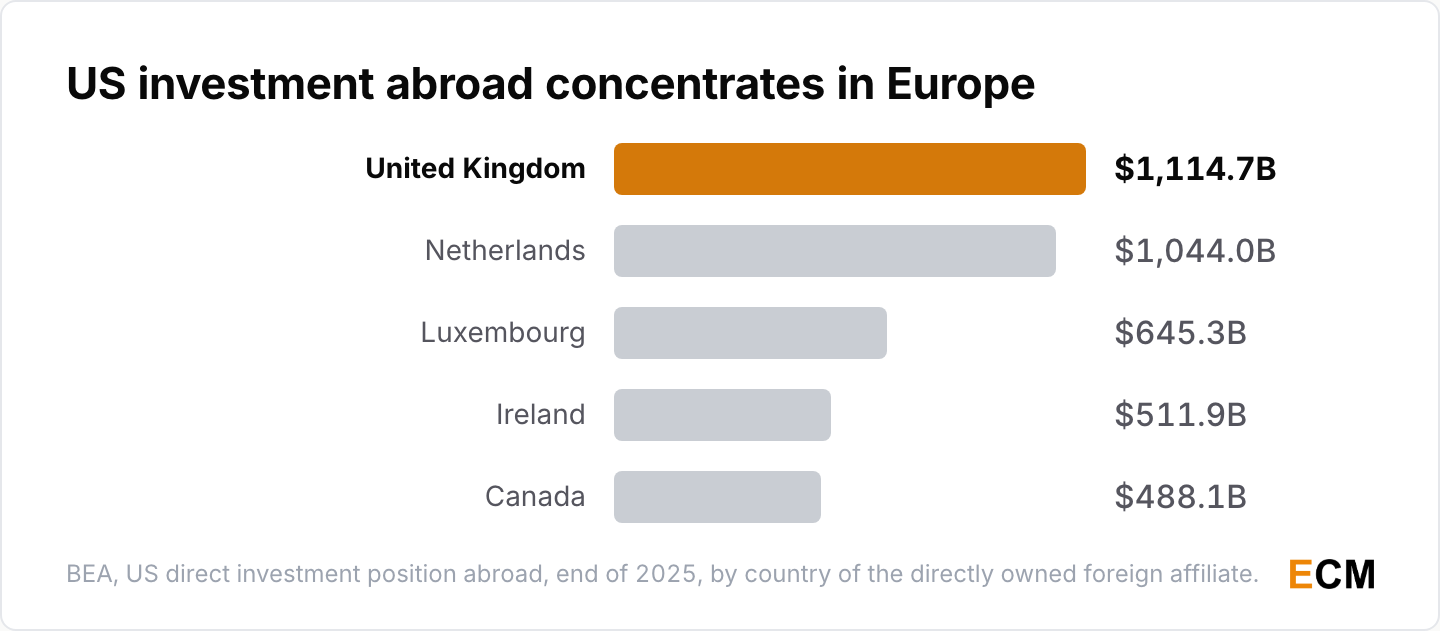
- The US direct investment abroad position increased $438.1 billion to $7.14 trillion at the end of 2025 (BEA, Direct Investment by Country and Industry, 2025).
- It was largest in the United Kingdom at $1,114.7 billion, then the Netherlands at $1,044.0 billion, Luxembourg at $645.3 billion, Ireland at $511.9 billion and Canada at $488.1 billion (BEA).
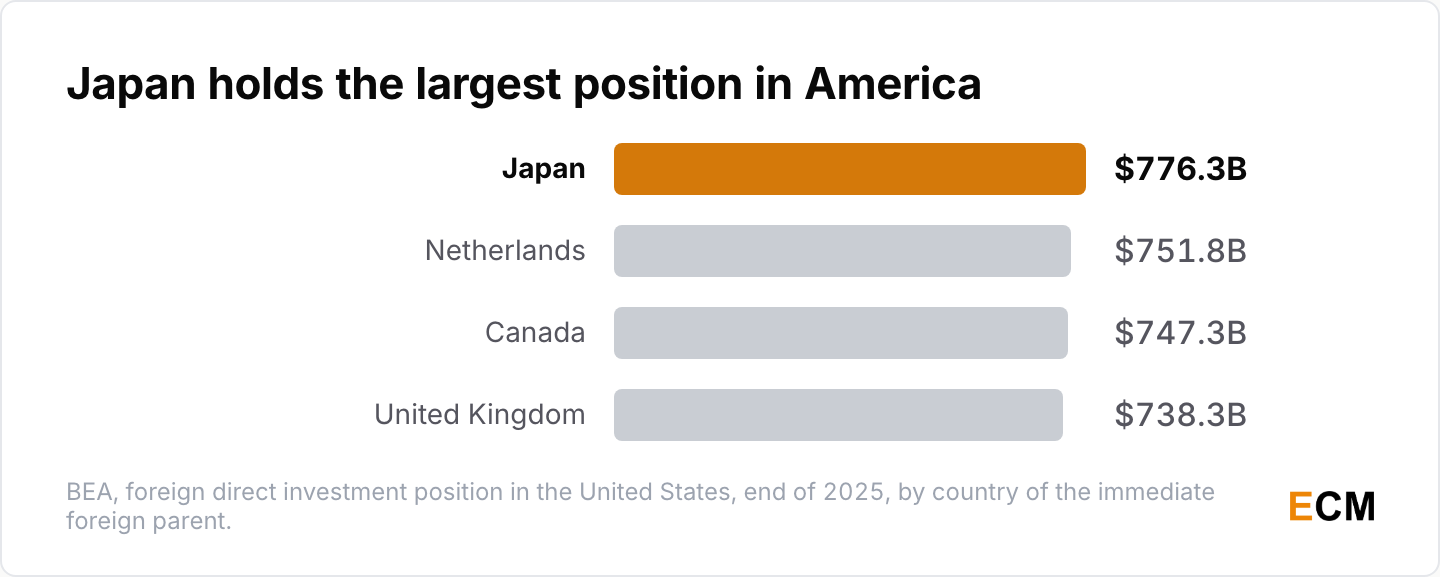
- The foreign direct investment position in the United States increased $266.0 billion to $5.86 trillion at the end of 2025 (BEA).
- Japan was the largest investing country at $776.3 billion, ahead of the Netherlands at $751.8 billion, Canada at $747.3 billion and the United Kingdom at $738.3 billion (BEA).
- Ranked instead by ultimate beneficial owner, the entity at the top of the ownership chain, Japan leads with $827.1 billion, Canada is second with $819.8 billion and Germany third with $706.2 billion (BEA).
Canada is $747.3 billion by immediate parent and $819.8 billion by ultimate owner, and Germany appears only in the second list. These are two different questions, and the honest answer to which country invests most in the United States depends on which one you are asking.
Which Industries the Money Enters
The same trillions look completely different depending on which industry classification you pick up.
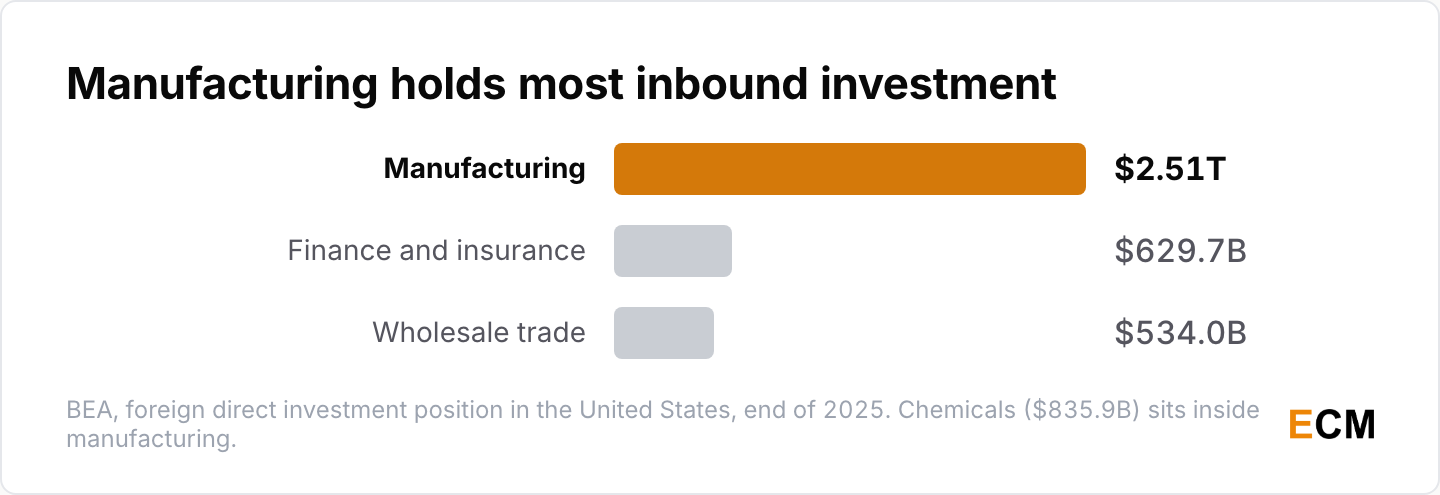
- Foreign investment into the US concentrated in manufacturing, which held 42.8% of the total position, or $2.51 trillion, with chemical manufacturing alone at $835.9 billion, finance and insurance at $629.7 billion and wholesale trade at $534.0 billion (BEA).
- Holding companies accounted for 45.8% of the US position abroad by the industry of the directly owned foreign affiliate, ahead of manufacturing at 15.9% and finance and insurance at 13.5%, but measured by the industry of the US parent, manufacturing multinationals accounted for 50.2% and finance and insurance for 15.8% (BEA).
- Expenditures by foreign investors to acquire, establish or expand US businesses totaled $232.2 billion in 2025, an increase of $76.8 billion, or 49.5%, on 2024 levels (BEA, New Foreign Direct Investment in the United States).
BEA publishes two industry breakdowns of the same $7.14 trillion, one classified by what the foreign affiliate does and one by what the US parent does. They are separate hundred-percent bases. Adding a number from one to a number from the other produces nonsense, which hasn’t stopped it happening.
That last figure is a flow of new transactions rather than a stock of accumulated ownership, which makes it the better number for whether foreign investment is picking up right now, and the wrong number for how much of America foreigners own.
AI Investment Statistics and Funding Totals
Here is where the money actually went, and where the measurement gets contested.
Global AI Investment Totals
One series carries the whole story of the last decade, and it’s not a smooth line.
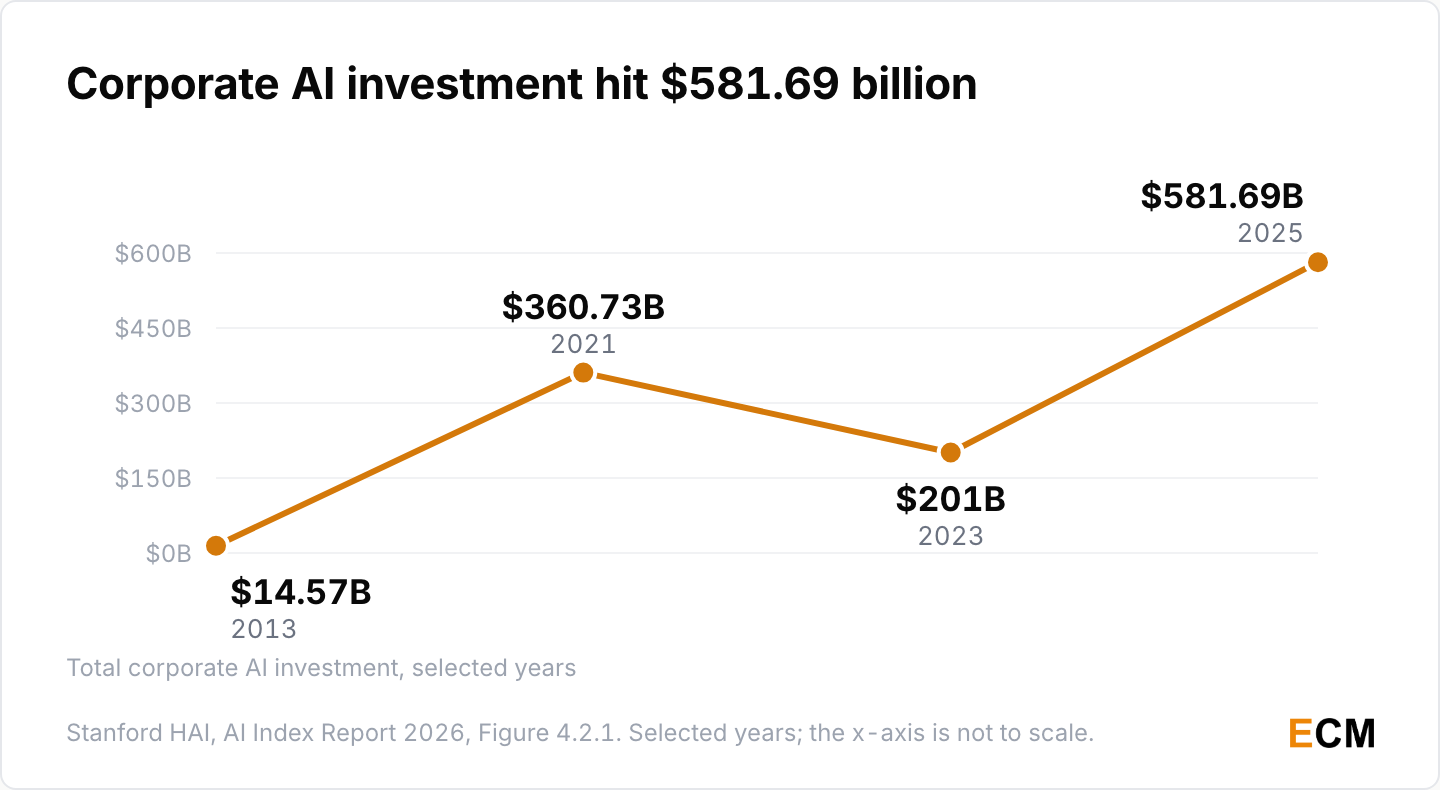
- Total corporate AI investment was $14.57 billion in 2013, peaked at $360.73 billion in 2021, fell to about $201 billion in 2023, then reached $581.69 billion in 2025, a 129.9% rise on the year (Stanford HAI, AI Index Report 2026).
- Global private investment in AI reached $344.7 billion in 2025, a 127.5% increase, with generative AI companies accounting for $170.9 billion of that total (AI Index 2026).
- The United States led with nearly $285.9 billion invested, 23.1 times China’s $12.4 billion (AI Index 2026).
The AI Index totals rest on Quid’s classifier rather than Stanford’s own counting, which is worth saying out loud when you quote a twelve-year series that shows roughly fortyfold growth.
Why the AI Funding Totals Disagree
Three credible totals landed within weeks of each other, and none of them measures the same thing.
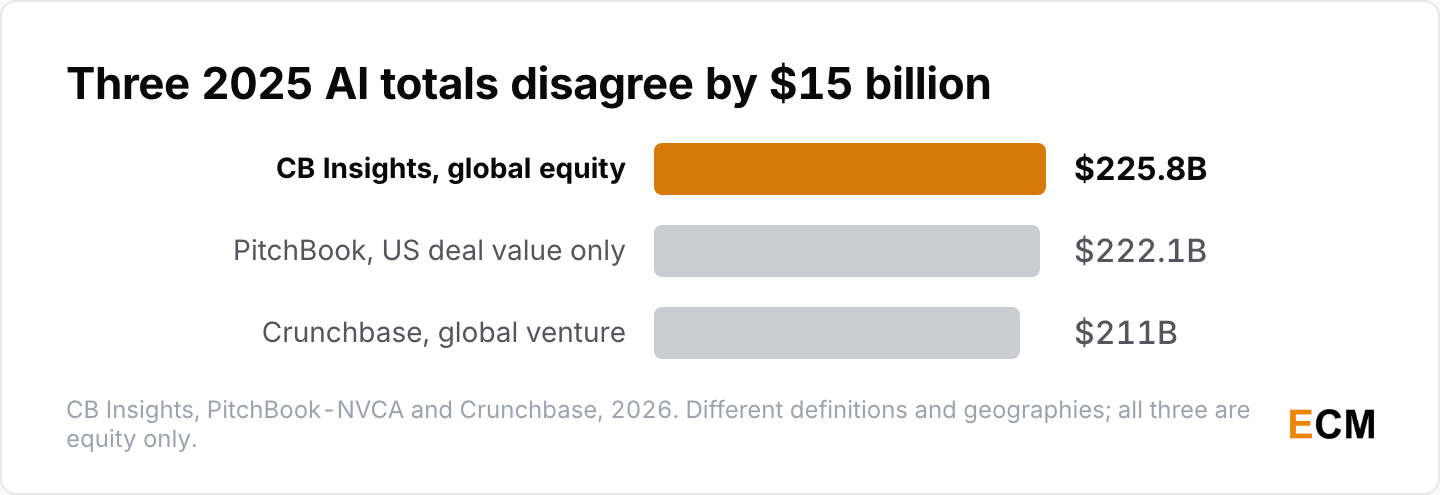
- Crunchbase counts global venture rounds and tags AI broadly across the whole stack, reaching $211 billion for 2025, up 85% from $114 billion in 2024 (Crunchbase News).
- PitchBook’s $222.1 billion is United States only, so it measures a smaller geography and still lands higher than Crunchbase’s global number (PitchBook-NVCA, Q4 2025).
- CB Insights counts global equity financings and folds in more robotics than the others, reaching $225.8 billion, of which mega-rounds of $100 million or more made up 79% (CB Insights, State of AI 2025).
Pick one, name it every time you cite it, and never average them. The gap between them is definitional, so the midpoint measures nothing.
One caveat applies to all three. They are equity only. The debt and capital-lease financing behind the largest AI infrastructure buildouts sits outside every one of these totals, which means all three understate the capital actually committed to the sector.
Where the AI Money Landed
Concentration is the real finding here, and it shows up by company and by metro area.
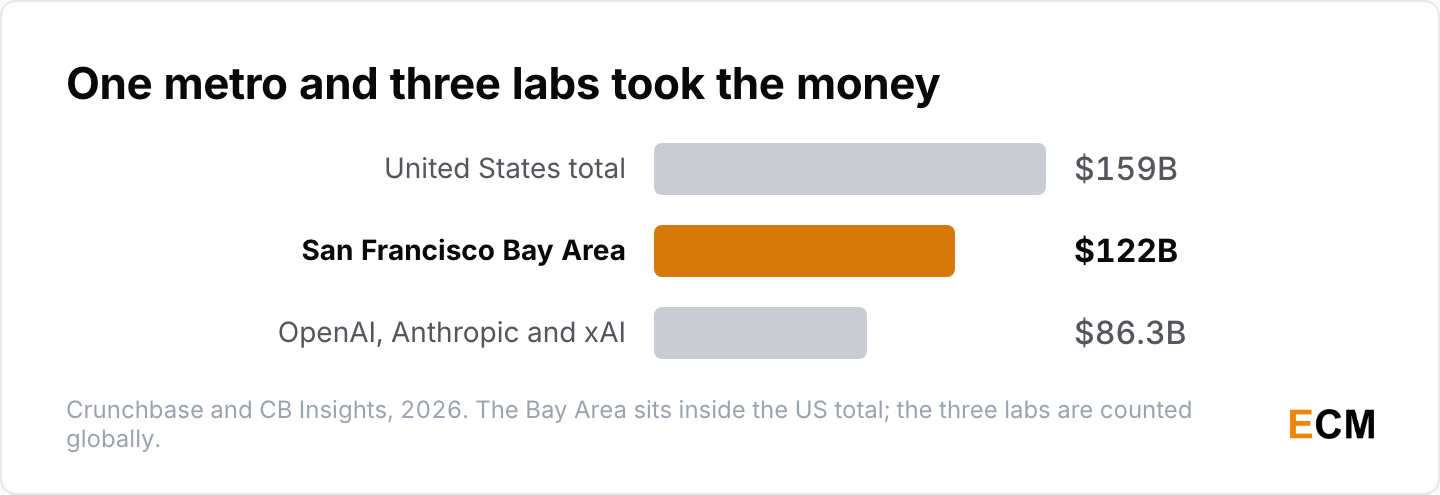
- OpenAI, Anthropic and xAI raised a combined $86.3 billion in 2025, which is 38% of all AI funding that year (CB Insights).
- The United States captured $159 billion, or 79%, of global AI funding in 2025, and the San Francisco Bay Area alone raised $122 billion of that (Crunchbase News).
- The Crunchbase Unicorn Board approached $7 trillion in collective value at the end of 2025, led by OpenAI at $500 billion, ByteDance at $480 billion, SpaceX at $400 billion and Anthropic at $183 billion (Crunchbase News, December 2025).
That 79% runs against Crunchbase’s own AI base of roughly $201 billion rather than the $211 billion headline above, so don’t divide one by the other.
Three companies took 38% of a record year, and one metro area took more than the rest of the world combined. If you are building a market model on AI funding growing 85%, that growth isn’t distributed in any way a typical company experiences.
Those two AI valuations are already stale. OpenAI’s $500 billion came from a secondary share sale and became $852 billion after its March 2026 round, and Anthropic’s $183 billion from September 2025 became $965 billion after its May 2026 Series H.
AI Infrastructure and Capital Spending
The equity totals above miss the largest line item in the sector, which is physical infrastructure.
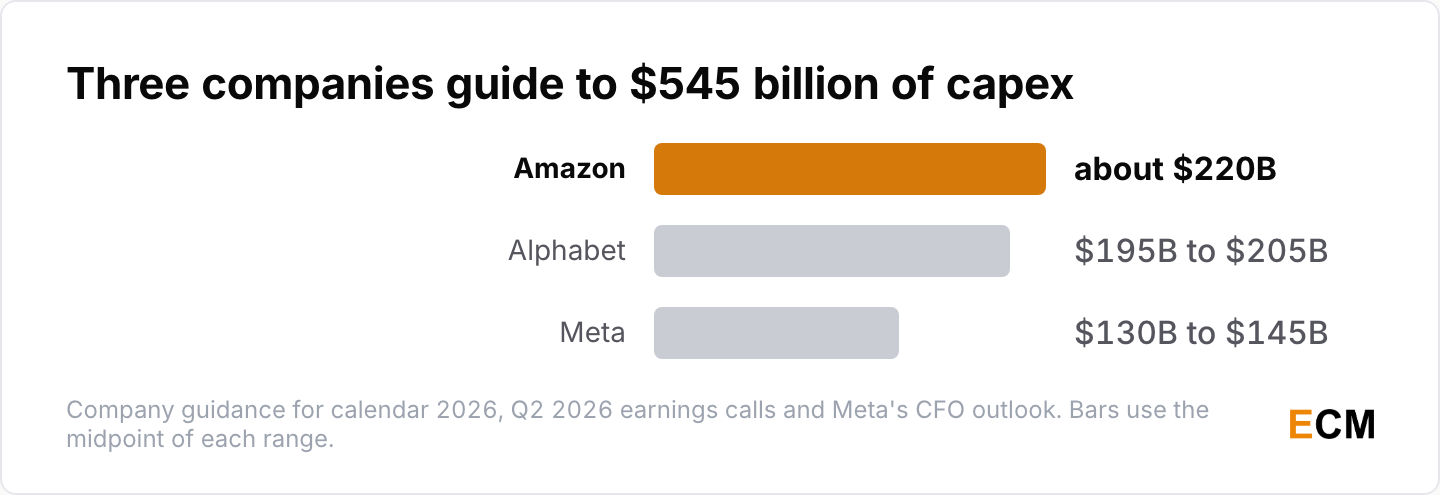
- Amazon expects to invest about $220 billion in capital expenditures in 2026, raised from roughly $200 billion guided earlier in the year (Amazon, July 2026).
- Alphabet raised its full-year 2026 capital expenditure guidance to $195 billion to $205 billion, up from a prior $180 billion to $190 billion (Alphabet, July 2026).
- Meta anticipates 2026 capital expenditures, including principal payments on finance leases, of $130 billion to $145 billion, narrowed from a prior $125 billion to $145 billion (Meta, July 2026).
- Microsoft’s additions to property and equipment totaled $115.9 billion in the fiscal year ended June 30, 2026 (Microsoft, fiscal 2026 results).
- NVIDIA’s fiscal 2026 revenue was $215.9 billion, up 65% year over year, with Data Center revenue up 68% to a record $193.7 billion and net income of $120.1 billion (NVIDIA, February 2026).
Inside that NVIDIA year, fourth-quarter revenue was $68.1 billion, up 20% sequentially and 73% year over year, and fourth-quarter Data Center revenue was a record $62.3 billion, up 22% sequentially and 75% year over year (NVIDIA).
A few things are worth stating plainly, because this cluster gets quoted carelessly more than any other on the page.
Only Meta publishes its capex guidance in the written earnings exhibit. Amazon’s and Alphabet’s figures come from what their executives said on the earnings call, which is a real disclosure but not a filed one. Microsoft hasn’t published comparable calendar-2026 guidance, so its audited fiscal-year actual stands in instead.
The fiscal years don’t line up either. NVIDIA’s fiscal 2026 ended in January 2026 and mostly covers calendar 2025, Microsoft’s ended in June 2026, and the other three run on calendar years. Summing these into one hyperscaler capex figure, which is done constantly, adds up periods that don’t overlap.
None of it’s purely AI, either. Amazon’s capital spending includes warehouses and delivery vans, and no company in this group breaks out an AI-only figure.
Venture Capital and Private Equity Statistics
Private capital is where the concentration shows up most sharply, and it overlaps with the wider startup statistics on funding, formation and failure rates.
US Venture Deal Value in 2025
Two numbers from the same report tell the whole story of the year.
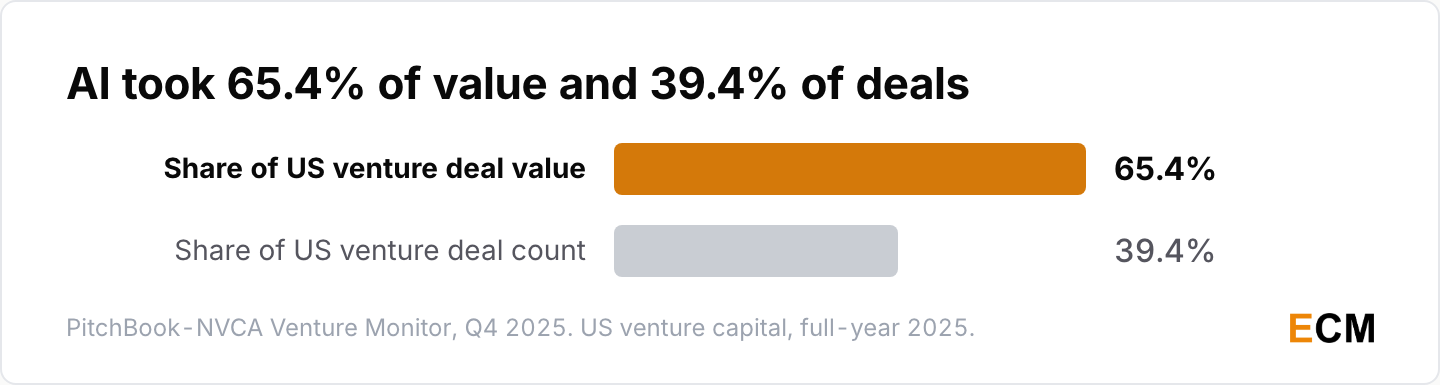
- AI represented 39.4% of US venture deal count in 2025 while taking 65.4% of deal value, which means AI rounds ran far larger than everything else being funded (PitchBook-NVCA, Q4 2025).
- US venture funds closed $66.1 billion in new commitments across 537 funds in 2025, the fewest funds in a decade, while 17 unicorns went public against a muted total listing count of 48 (PitchBook-NVCA).
- US venture exits generated $297.6 billion across an estimated 1,635 exits, with acquisitions contributing $140.7 billion across 1,029 transactions (PitchBook-NVCA).
The fundraising line is the one optimistic write-ups skip. Record deployment into AI is happening at the same time as the weakest fund formation in ten years. The money going into startups right now is substantially money raised in earlier vintages.
The Largest AI Funding Rounds
The four largest disclosed rounds all went to two companies, and three of them closed in 2026.
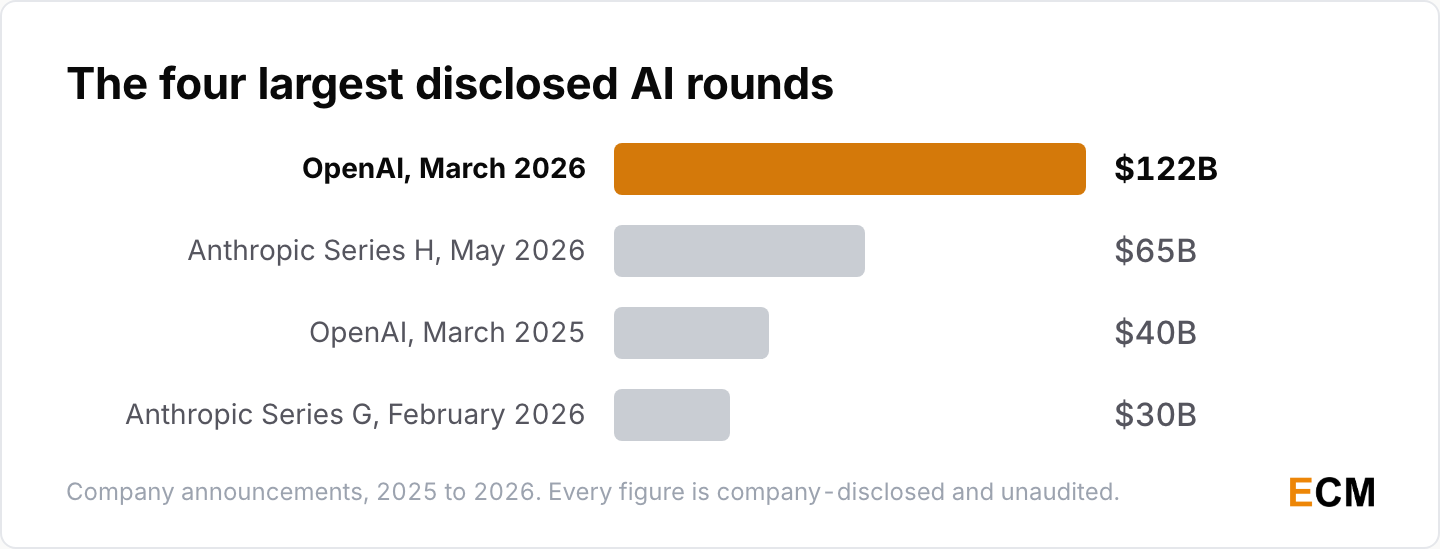
- OpenAI completed a $122 billion round at an $852 billion post-money valuation on March 31, 2026 (OpenAI).
- Anthropic raised $65 billion in a Series H led by Altimeter Capital, Dragoneer, Greenoaks and Sequoia Capital at a $965 billion post-money valuation in May 2026 (Anthropic).
- OpenAI raised $40 billion at a $300 billion post-money valuation on March 31, 2025, led by SoftBank Group (OpenAI).
- Anthropic raised a $30 billion Series G led by GIC and Coatue at a $380 billion post-money valuation in February 2026 (Anthropic).
Every figure in this block is company-disclosed and unaudited. The next-largest round I could find, xAI’s $20 billion Series E in January 2026 (CNBC), doesn’t come close. Anthropic’s post-money valuation rose roughly fivefold in eight months, from $183 billion to $965 billion.
Private Equity Deals and Exits
Buyout funds had their best exit year since the last cycle peak, and their fees finally moved.
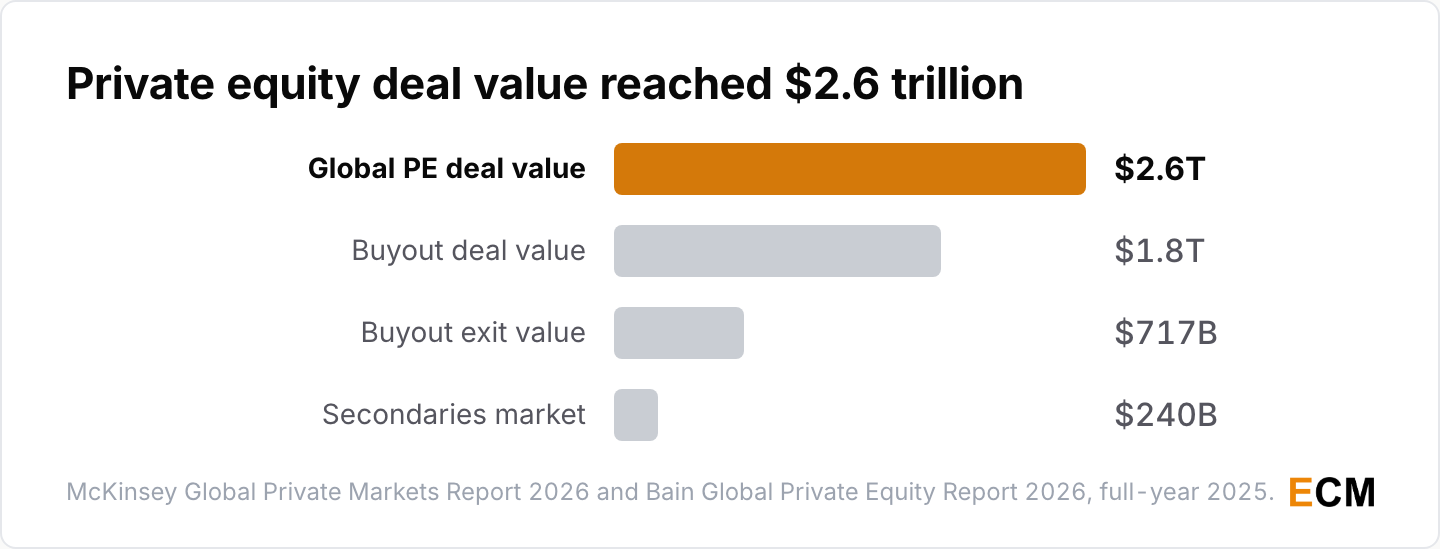
- Global private equity deal value reached $2.6 trillion in 2025, a 19% increase, with buyout deal value up 20% to $1.8 trillion (McKinsey, Global Private Markets Report 2026).
- The secondaries market reached $240 billion in 2025, up 48% on 2024’s $162 billion record (McKinsey).
- Buyout exit value reached $717 billion in 2025, up 47% year over year and the second-best year on record, with seven exits above $10 billion contributing $155 billion (Bain, Global Private Equity Report 2026).
- The average buyout management fee fell to 1.6% in 2025, down roughly 20% from the traditional 2% level (Bain, citing Preqin).
The biggest single deal sat on the buying side rather than the exit side: Bain records the $56.6 billion Electronic Arts take-private as the largest buyout on record (Bain, February 2026).
Both McKinsey and Bain advise the industry they report on. That doesn’t make the deal data wrong, since it comes from Preqin, PitchBook and Dealogic, but it does shape which findings get headlined.
The fee number is the one I’d watch. Compression of that size says more about the balance of power between funds and their investors than any deal-value record does.
Stock Market and Capital Markets Statistics
Public markets dwarf private ones, and their composition surprises people who follow only the equity headlines.
Global Market Size and Financing
Bond markets are marginally bigger than stock markets, which catches out anyone watching only indices.
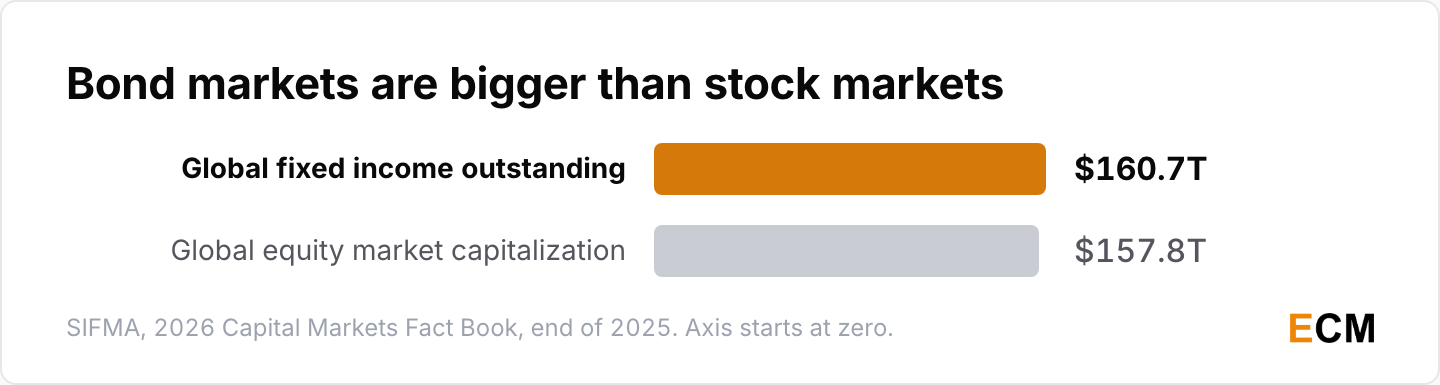
- Global fixed income markets outstanding rose 10.6% to $160.7 trillion in 2025, just ahead of global equity market capitalization at $157.8 trillion (SIFMA, 2026 Capital Markets Fact Book).
- Equity and debt securities accounted for 81.2% of financing for US non-financial corporations in 2025, up from the 75.3% reported in SIFMA’s 2025 Fact Book (SIFMA, 2026 Capital Markets Fact Book, August 2026).
- US investment advisers reported $176.8 trillion in regulated assets under management in 2025, up 22.3% from $144.6 trillion, across 16,544 advisers serving 73.7 million clients (Investment Adviser Association, 2026 Industry Snapshot).
The financing split is the most useful number here for anyone arguing about how companies actually fund themselves. In the United States, banks are the minority lender.
Derivatives Volume Collapsed in 2025
The record everyone still quotes was real, was driven by one product in one country, and is gone.
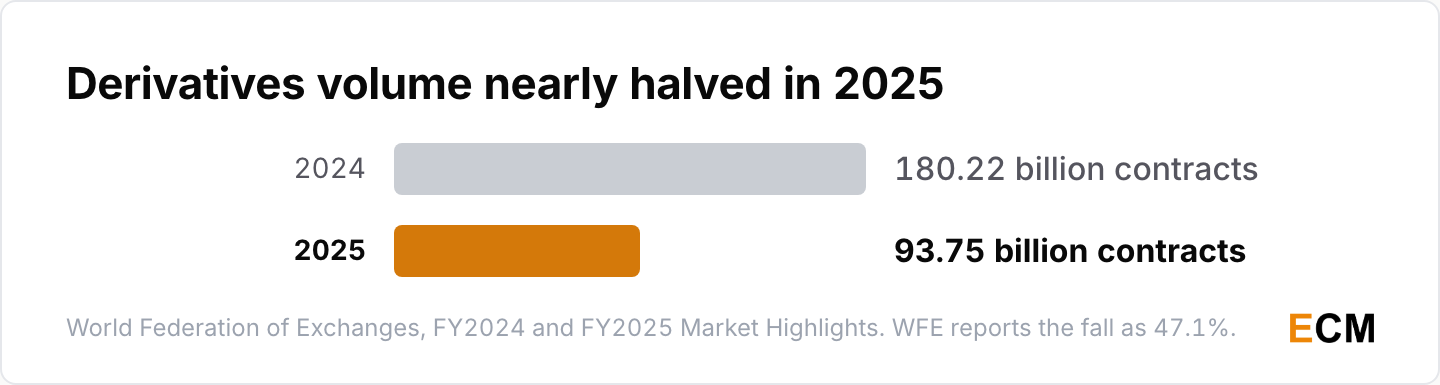
- Exchange-traded derivatives volume hit a record 180.22 billion contracts in 2024, a 38.8% increase on 2023, split 153.30 billion options and 26.92 billion futures (World Federation of Exchanges, FY2024 Market Highlights).
- Volume then fell to 93.75 billion contracts in 2025, split 63.51 billion options and 30.24 billion futures, a decline WFE reports as 47.1%, with equity derivatives driving the reversal through a 58.4% collapse after Indian regulatory changes to weekly index options (WFE, FY2025 Market Highlights, February 2026).
The two published annual totals imply a 48.0% fall rather than 47.1%, and WFE doesn’t explain the gap, so quote its figure rather than deriving your own.
This is one of the cleanest examples in finance of a headline number that was real, was driven almost entirely by one product in one country, and collapsed when that country changed a rule.
IMF Projections and Digital Assets
Two official series round out the public-markets picture, one macroeconomic and one regulatory.
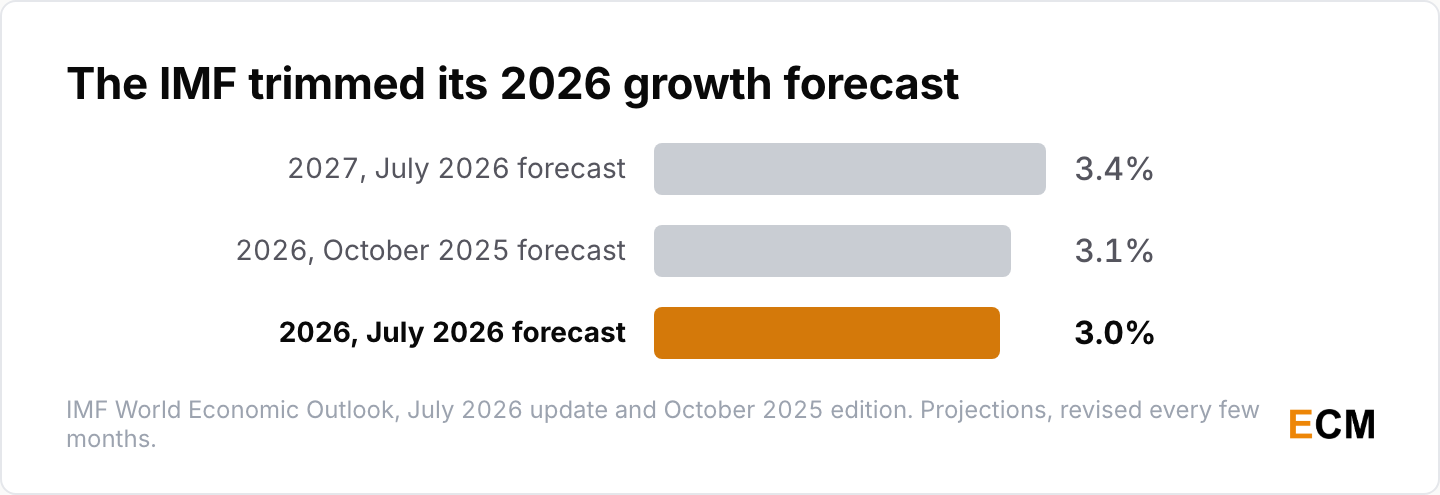
- The IMF projects global growth at 3.0% for 2026 and 3.4% for 2027 (IMF, World Economic Outlook Update, July 2026).
- Its October 2025 edition had projected growth slowing from 3.3% in 2024 to 3.2% in 2025 and 3.1% in 2026, with global inflation declining to 4.2% in 2025 and 3.7% in 2026 (IMF, World Economic Outlook, October 2025).
- The same edition warned that “an abrupt repricing of tech stocks could be triggered by disappointing results on earnings and productivity gains related to artificial intelligence”, with “the possibility of broader implications for macrofinancial stability” (IMF, October 2025).
- The SEC approved 11 spot Bitcoin exchange-traded products on January 10, 2024 (SEC order approving spot Bitcoin ETPs) and 8 spot Ether products on May 23, 2024 (SEC order approving spot Ether ETPs).
The IMF warning deserves more attention than it gets in investment roundups, given that most of this page is about capital flooding into exactly those tech stocks. The institution publishing the growth forecasts is also the one flagging the concentration risk. These are projections, revised every few months, and the two vintages above show how much they move.
The Ether order didn’t prohibit staking. Staking wasn’t part of the proposals the SEC approved, and any future staking proposal would need its own approval, which is a meaningfully different statement. The $4.6 billion first-day trading-volume figure usually attached to the Bitcoin approvals comes from press reporting in January 2024. The SEC order itself carries no trading-volume figure.
Fund, ETF and Investor Statistics
This is the retail end of the market, and it’s where the measurement is best. It’s also the other side of the ledger from the creator economy statistics and gig economy statistics pages, where capital reaches individuals rather than institutions.
ETF Net Issuance Hit Records
Money kept moving into passive wrappers, and the flow more than doubled in two years.
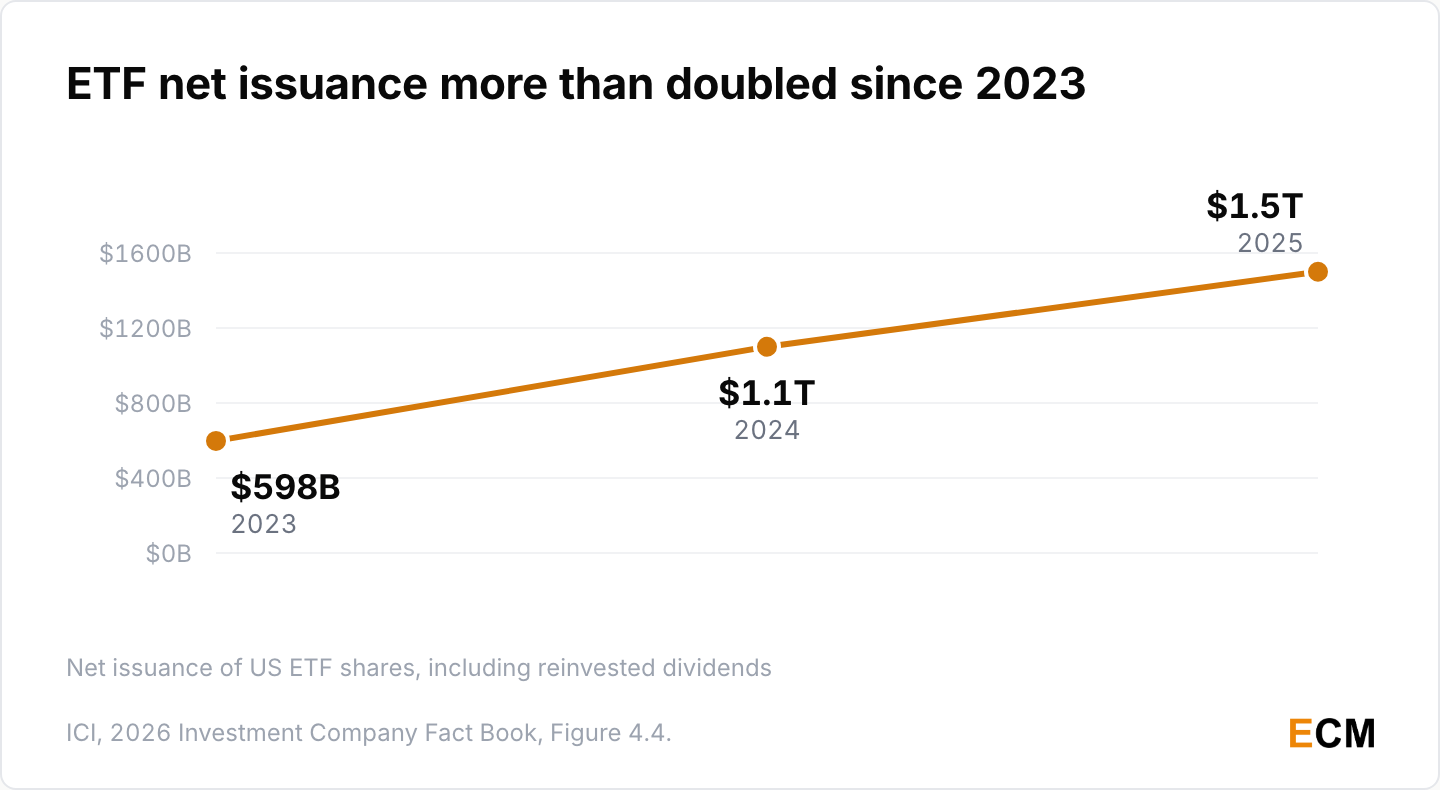
- Net issuance of US ETF shares, including reinvested dividends, surged to a record $1.5 trillion in 2025, up from $1.1 trillion in 2024 and $598 billion in 2023 (ICI, 2026 Investment Company Fact Book, Figure 4.4).
- At year-end 2025 the US ETF market held $13.4 trillion in total net assets across 4,495 funds, which is 70% of the $19.2 trillion held in ETFs worldwide (ICI, 2026 Fact Book).
- 1,099 ETFs were launched in 2025 and 224 were liquidated or merged, after 758 launches and 174 closures in 2024 (ICI, 2026 Investment Company Fact Book, Figure 4.5).
A year earlier the US ETF market held $10.3 trillion across 3,637 funds, the first time it had passed $10 trillion. Those launch and closure counts don’t reconcile neatly with the fund counts, because ICI restates prior-year figures between editions.
Who Actually Owns Stock
Two authoritative surveys give different answers, and both are right about different populations.
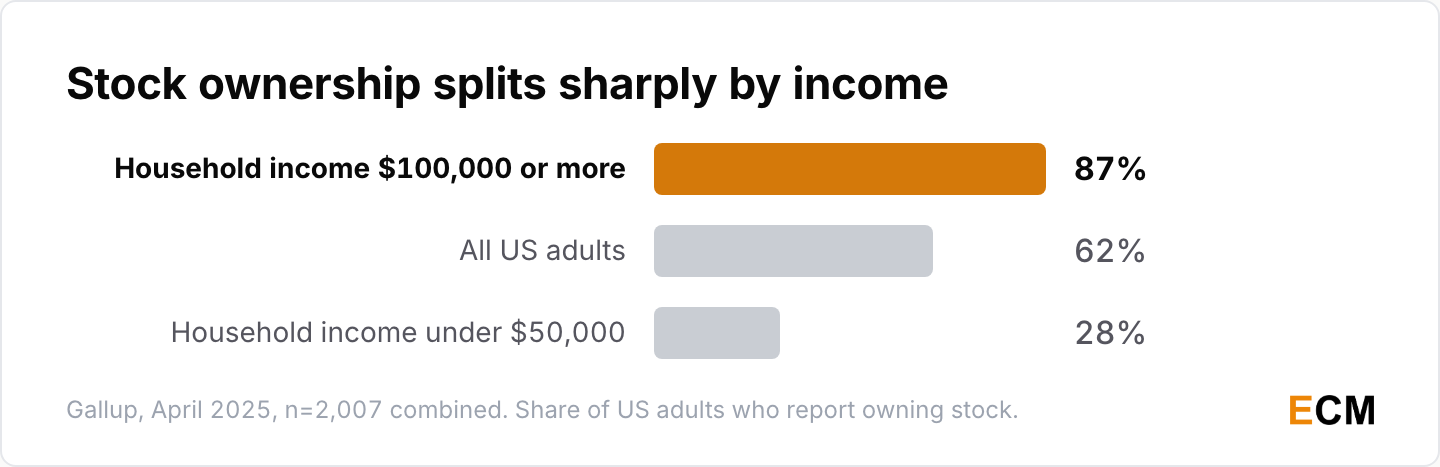
- 62% of US adults reported owning stock in 2025, matching 2024 and close to 2023’s 61%, which is still the latest reading on Gallup’s own results page (Gallup, April 2025, n=2,007 combined).
- Ownership splits sharply by income, at 87% among households earning $100,000 or more against 28% among those earning under $50,000 (Gallup).
- 58% of US families held stock directly or indirectly in 2022, up from 53% in 2019, with direct ownership rising from 15% to 21%, which the Federal Reserve calls the largest change on record for that measure (Federal Reserve, Survey of Consumer Finances).
- The conditional median value of those combined holdings was $52,000, while 54.3% of families held retirement accounts with a conditional median of $86,900 against a conditional mean of $334,000 (Federal Reserve SCF, 2022).
Gallup asks individual adults whether they own stock. The Federal Reserve surveys families and counts indirect holdings through retirement accounts. Different unit, different instrument, different year, which is why the two headline shares never match.
The gap between median and mean on retirement accounts is the number I’d put in front of someone. A median of $86,900 against a mean of $334,000 tells you the distribution is dominated by a small group at the top, which no single average captures.
The Survey of Consumer Finances runs every three years and 2022 remains the most recent published wave, so these are the freshest official US household figures available.
Retirement Assets and Fund Flows
The retirement system is the largest single pool of invested household money in the country.
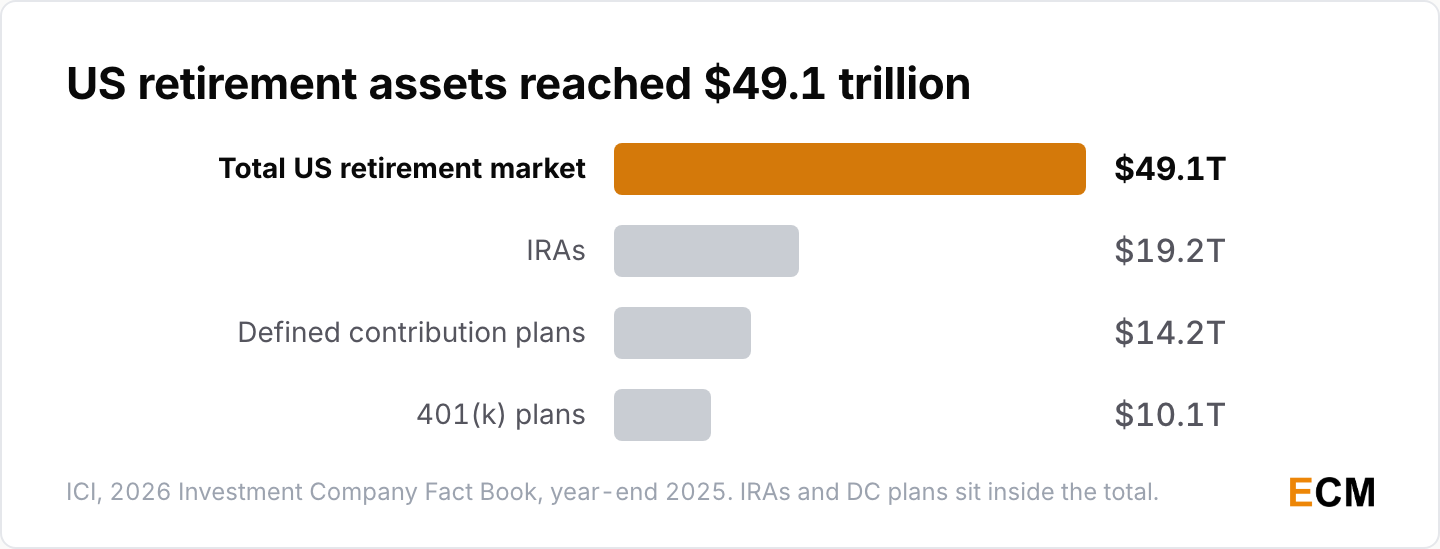
- US households had $49.1 trillion earmarked for retirement at year-end 2025, up 11% from $44.2 trillion a year earlier (ICI, 2026 Investment Company Fact Book, Figure 8.5).
- IRAs held $19.2 trillion of that and defined contribution plans an estimated $14.2 trillion, of which 401(k) plans held $10.1 trillion, with 44% of IRA and DC assets in mutual funds (ICI).
- Worldwide net sales of regulated long-term funds were $2.2 trillion in 2025, with US net inflows falling from $976 billion in 2024 to $680 billion while European net sales rose from $487 billion to $808 billion (ICI).
- Fund providers globally offered 148,692 regulated funds at year-end 2025, 41% of them in Europe, with equity funds the largest type at 33% (ICI, Figure 1.1).
The US and European flows moved in opposite directions by roughly the same magnitude, which is worth noticing before anyone describes 2025 as a uniformly strong year for fund flows.
Related reading: content marketing statistics and digital marketing statistics.
Frequently Asked Questions
What percentage of Americans have over $100,000 invested in the stock market?
No survey publishes that figure directly. 58% of US families held stock directly or indirectly in 2022, with a conditional median of $52,000 (Federal Reserve SCF).
Since the median holder sits at $52,000, fewer than half of the families who own stock at all have more than $100,000 in it, which puts the share of all US families above $100,000 under 29% (Federal Reserve SCF).
Gallup’s 87% is the share of households earning over $100,000 a year who own stock (Gallup). That’s income, not holdings.
Which country invests most in the United States?
Japan, on both of BEA’s measures, but the runner-up changes. By country of the immediate foreign parent, Japan holds $776.3 billion and the Netherlands $751.8 billion (BEA).
By ultimate beneficial owner, Japan holds $827.1 billion, Canada is second at $819.8 billion and Germany third (BEA). The Netherlands ranks far higher on the first measure because multinationals route ownership through it.
What are the current investment trends?
Three dominate the data. Capital is concentrating in AI, at 65.4% of US venture deal value (PitchBook-NVCA). Cross-border flows recovered, with global FDI up 6% to $1.6 trillion (UNCTAD).
And retail money kept moving into passive wrappers, with US ETF net issuance at a record $1.5 trillion (ICI). Adoption runs ahead of spend: 88% of organizations reported using AI in 2025, up from 78% in 2024, and 70% use generative AI in at least one business function (AI Index 2026).
Is a 20% return on investment good?
It’s roughly double the long-run average for US equities, so as a single-year result it’s strong. As a planning assumption it’s not reasonable.
The context worth holding is the IMF’s warning that “an abrupt repricing of tech stocks” could carry “broader implications for macrofinancial stability” (IMF, October 2025), given that technology has driven a large share of recent index returns.
Why do AI funding totals differ between sources?
Because the publishers count different things. Crunchbase reported $211 billion globally (Crunchbase), PitchBook $222.1 billion for the United States alone (PitchBook-NVCA), and CB Insights $225.8 billion globally (CB Insights), all for 2025.
The differences come from how each defines an AI company, whether robotics is included, and whether the geography is global or US-only. All three are equity only.
What do foreign direct investment statistics measure?
They measure lasting ownership stakes in businesses across borders, not portfolio trades. The threshold that separates the two is ownership of at least 10% of the voting securities of a business (BEA glossary).
Positions measure accumulated ownership at a point in time, which is why the US position abroad stands at $7.14 trillion while annual flows run in the hundreds of billions (BEA).
What are the latest trends in the retirement market?
Assets grew faster than contributions. US retirement assets reached $49.1 trillion at year-end 2025, up 11% on the year, with IRAs at $19.2 trillion and defined contribution plans at an estimated $14.2 trillion (ICI, Figure 8.5).
Mutual funds still hold 44% of IRA and defined contribution assets, so the shift toward ETFs hasn’t displaced them inside retirement accounts (ICI, Figure 8.15).
Where can I find official investment statistics?
For cross-border positions, BEA covers the United States, and UNCTAD and OECD cover global flows. For funds, ETFs and retirement assets, ICI publishes an annual Fact Book free. For capital markets size, SIFMA’s Fact Book is free.
For exchange volumes, the World Federation of Exchanges publishes market highlights. For US household holdings, the Federal Reserve’s Survey of Consumer Finances is the authority. The AI Index, the ICI Fact Book and the SIFMA Fact Book all publish long back-series.
Written by
Editorial Staff
The Editorial Staff represents the writers, editors, and content creators who have worked (or work) at Elite Content Marketer. The experimenter-in-chief behind the team is Chintan Zalani, who has close to a decade of experience trying to make sense of the content marketing industry. Started in 2019, Elite Content Marketer is on a mission to help creators build sustainable businesses.
Related Articles

Marketing Data
58 AI Personalization Statistics for 2026: ROI + Adoption
58 AI personalization statistics for 2026: 78% of marketers can’t make enough personalized content, and 87% of brands rate it good while 29% of consumers agree.
Oct 2, 2026Read more →
Marketing Data
60 AI Workflow Automation Statistics for 2026
60 AI workflow automation statistics for 2026: 37% of respondents see any EBIT impact from AI, 6% are high performers, and agents scale at big firms.
Oct 1, 2026Read more →
Marketing Data
AI Image Generation Statistics 2026: 60 Data Points
60 AI image generation statistics for 2026: people now create more than 3 billion images a week with ChatGPT Images and OpenAI’s API.
Sep 30, 2026Read more →