Women hold 29% of C-suite roles in corporate America, unchanged since 2024 (LeanIn.Org and McKinsey, 2025). These women in tech statistics come from the organizations that collected the data. Company-level numbers have thinned out since Google, Microsoft and Meta stopped publishing diversity reports.
Women in Tech Statistics 2026: 60 Gender Gap Numbers
 Written by Editorial Staff
Key Takeaways
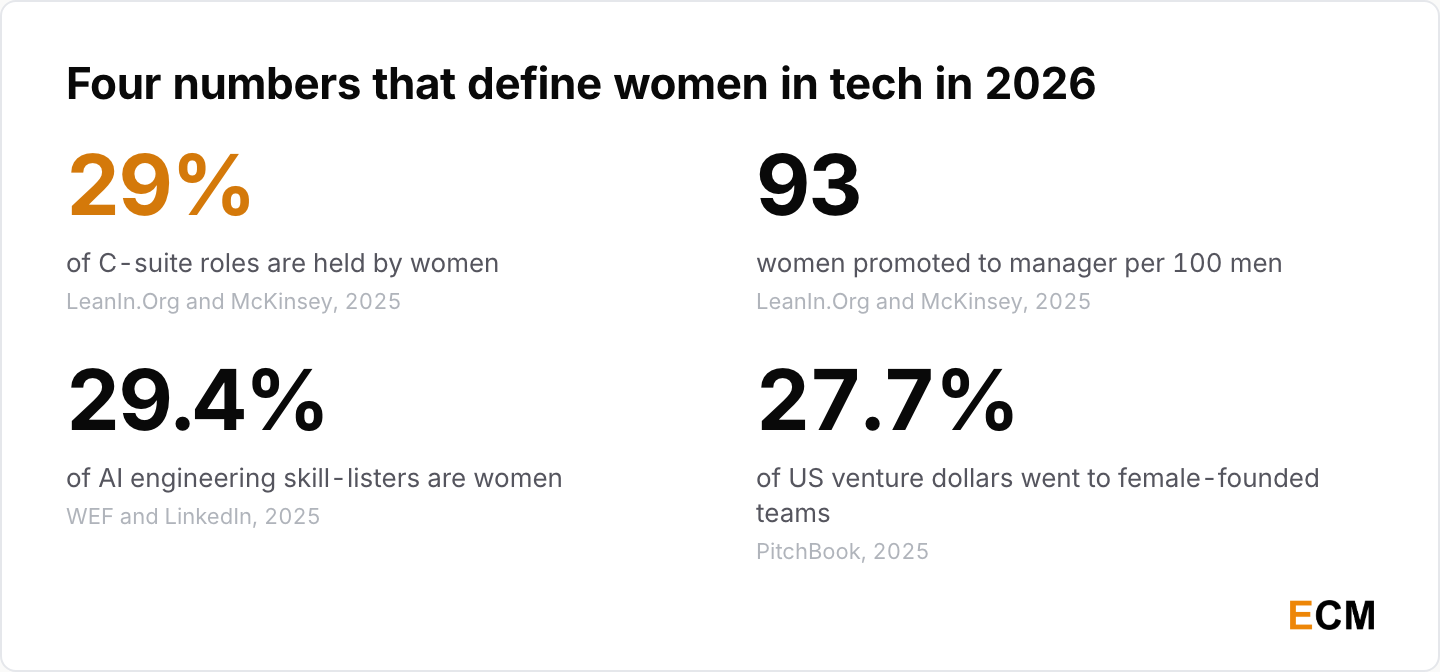
- Every “women in tech” percentage disagrees with the next one, and all of them are right. 27.2% of Microsoft’s technical roles (2024), 29.4% of AI engineering skill-listers (2025), 35% of the US STEM workforce (2023 edition). Name the population or the number means nothing.
- The broken rung is the bottleneck, not the glass ceiling. For every 100 men promoted to manager, 93 women are promoted, and 60 Black women (LeanIn.Org and McKinsey, 2025). Eleven editions in, that first step has barely moved.
- Europe counts differently and lands lower. Women were 19.5% of ICT specialists employed in the EU in 2024 (Eurostat, 2025).
- Big Tech has stopped showing its work. Google’s last diversity report covers 2024, Microsoft’s covers 2024, and Meta’s last standalone report is the 2022 edition. The disappearance of the disclosures is now part of the story.
- The consumer AI gap closed. The workplace one didn’t. Typically feminine names went from 37% to 52% of classifiable ChatGPT users between January 2024 and July 2025 (OpenAI, 2025), while men’s reported AI use still runs 47.8% against women’s 39.3% (Harvard Business School, 2026).
- AI hiring is rebuilding the gap from scratch. Women were 26% of US hires into AI roles in 2025 against 50% of hires into everything else (LinkedIn Economic Graph, 2026).
- Female founders had a record year that mostly wasn’t theirs. Companies with at least one woman founder took 27.7% of US venture dollars in 2025, an all-time high, while all-female teams took $3.2 billion (PitchBook, 2026).
Women in Technology Workforce Representation
This is where the definitional problem lives. “Women in tech” can mean computing occupations, tech roles inside technology companies, or STEM fields as a whole, and writers swap the three constantly.
Global and European Representation
Global progress is real, slow, and slower still once you look at who holds the decisions.
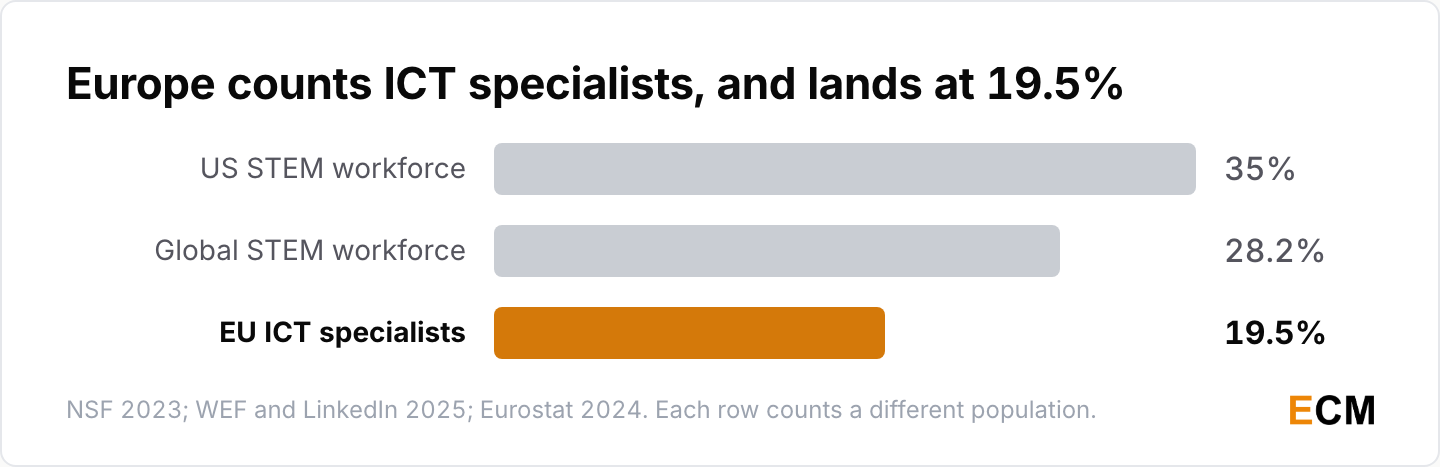
- Women were 19.5% of ICT specialists employed in the EU in 2024, against 80.5% men (Eurostat, 2025). This is the tightest definition on the page and it produces the lowest number.
- Women were 28.2% of the global STEM workforce in 2024, up from 26.1% in 2016 (World Economic Forum and LinkedIn, Gender Parity in the Intelligent Age, March 2025).
- The global gender gap stands at 68.8% closed, putting full parity 123 years away, while the economic participation gap is 60.7% closed, up from 55.1% in 2006, and projected to take 135 years (World Economic Forum, Global Gender Gap Report 2025, June 2025).
- Women are 40.2% of the global workforce but hold 28.8% of management positions (World Economic Forum, 2025).
- The 2021 edition of the same report put women at 14% of cloud computing roles, 20% of engineering and 32% of data and AI (World Economic Forum, Global Gender Gap Report 2021). Four editions have been published since and none repeats that breakdown, which is why a 2021 figure still circulates today.
United States Computing Occupations
The US labour force is close to balanced. The computing slice of it is not.
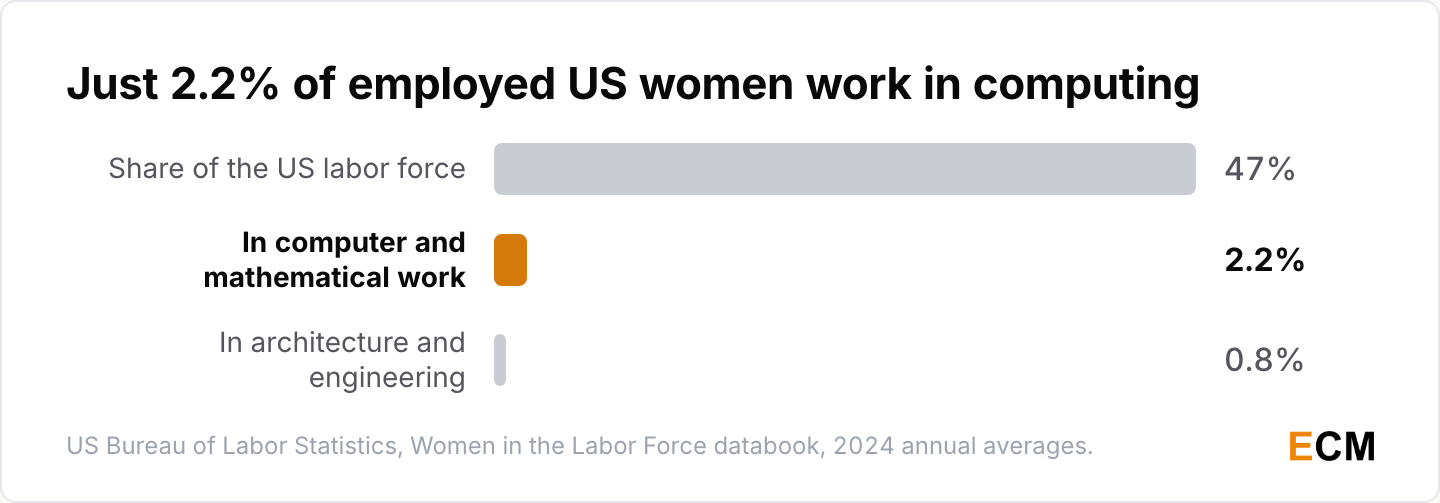
- Women make up 47% of the US labor force, with a participation rate of 57.5% (US Bureau of Labor Statistics, Women in the Labor Force databook, 2024 annual averages).
- Just 2.2% of employed women work in computer and mathematical occupations, and 0.8% in architecture and engineering (US Bureau of Labor Statistics, 2024).
- Women were 35% of the US STEM workforce in 2021, up from 32% in 2011 (National Center for Science and Engineering Statistics, 2023 edition), and of the 36 million people in that workforce in 2023, 65% were men (National Science Board, 2026).
The BLS category matters here. “Computer and mathematical occupations” covers more than a dozen job codes, from software developers to statisticians, and counts people in those roles across every industry rather than people employed by technology companies.
Inside the Big Technology Firms
Tech companies measure a different population again in their own disclosures, and they measure it generously.
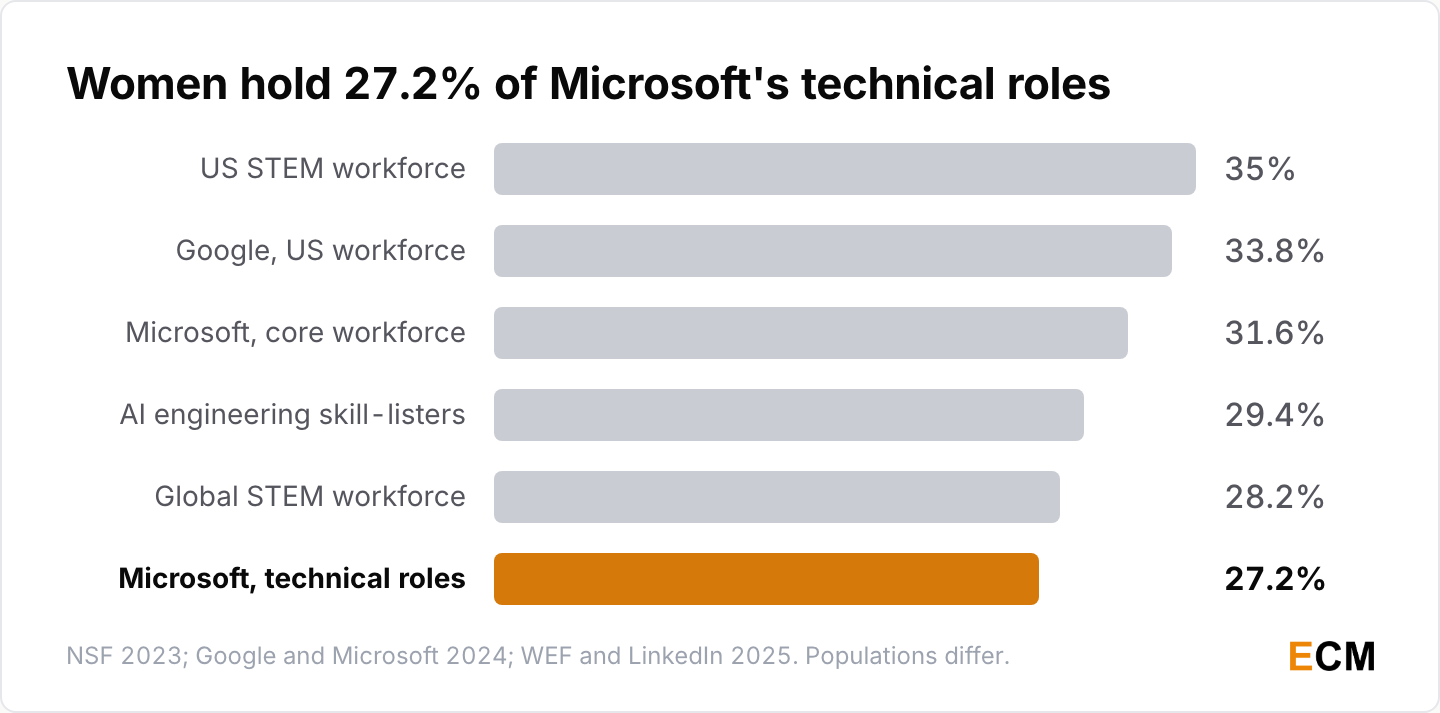
- Women made up 31.6% of Microsoft’s core workforce, up 0.4 percentage points year over year, and held 27.2% of its technical roles (Microsoft Global Diversity and Inclusion Report 2024, October 2024).
- Women made up 33.8% of Google’s US workforce (Google Diversity Annual Report 2024).
- Women held 39% of data, analytics and AI roles in 2024, three percentage points lower than a decade earlier, and 29% of senior leadership positions inside those same roles (Revelio Labs).
Revelio infers gender from names on public profiles rather than asking people, so treat it as an estimate with a real error bar. It is here because it covers a population the company disclosures no longer do.
The Big Tech Reporting Blackout
For a decade the answer to “how many women work at Google” was a link to a report Google published. That stopped.
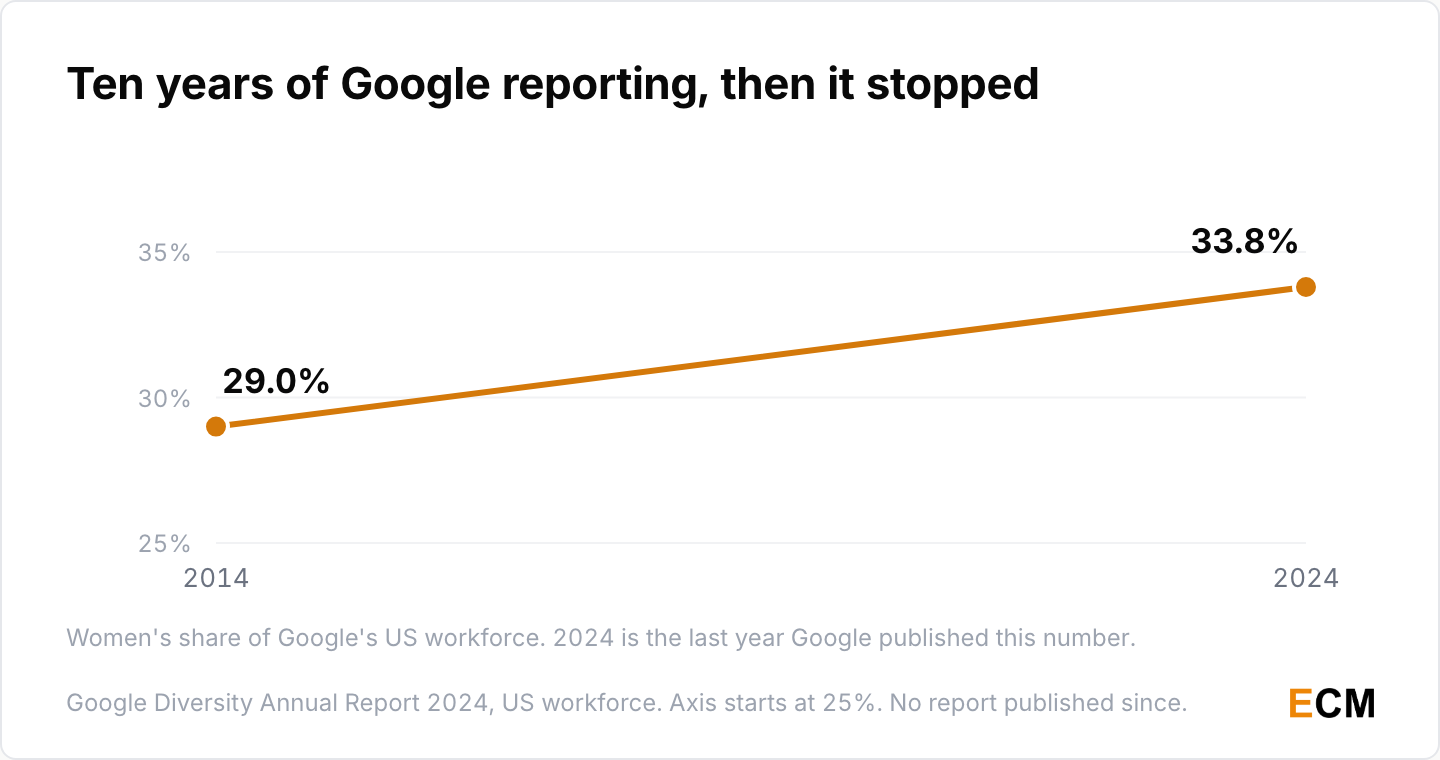
- Google’s US women’s share was 29.0% in 2014. Ten years of annual reporting moved it 4.8 percentage points (Google Diversity Annual Report 2024).
- Alphabet’s annual report filed in February 2025 contains no diversity commitment and no representation goals, language earlier filings carried. Google published no 2025 diversity report.
- Microsoft’s October 2024 report is its last. It published none in 2025, saying it had moved to formats that are “more dynamic and accessible” (contemporaneous reporting, 2025).
- Meta ended its Diverse Slate Approach, its DEI team and its supplier diversity program in January 2025 (internal memo published in full), and its last standalone diversity report remains the 2022 edition.
- Amazon said it was winding down what it called outdated diversity programs by the end of 2024 (internal memo reported at the time), and still publishes aggregate US workforce demographics, most recently as of 31 December 2024.
Every 2026 figure about Big Tech representation is now either a 2024 number wearing a 2026 date or a third-party estimate built from scraped profiles. Three of the five largest technology companies no longer answer the question themselves.
The Gender Pay Gap in Tech
National statistics are the defensible ground here. Sector-level tech pay-gap figures mostly come from vendor surveys with self-selected samples.
US and UK Pay Gap Figures
Two governments measure the same idea in ways that are not comparable, which is why the headline numbers differ so much.
- US women working full time had median weekly earnings of $1,043 against $1,261 for men (US Bureau of Labor Statistics, Highlights of Women’s Earnings, 2024).
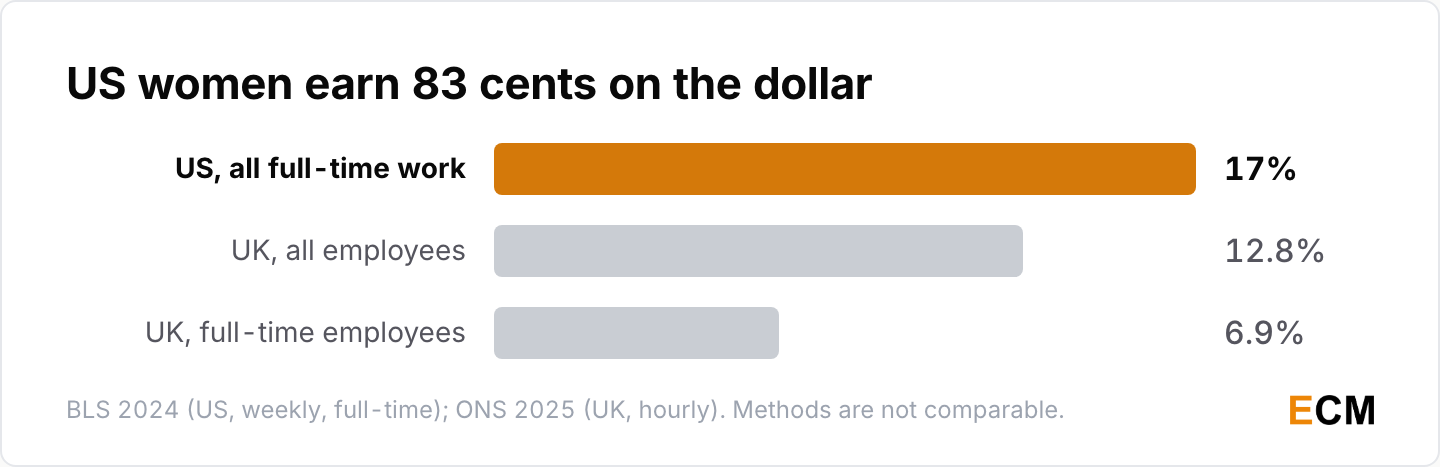
- That works out to 83 cents on the dollar, a 17% gap across all full-time work (US Bureau of Labor Statistics, 2024).
- The UK full-time gender pay gap was 6.9% in April 2025, down from 7.1% (Office for National Statistics, October 2025).
- The UK all-employees gap, which includes part-time work, was 12.8%, down from 13.1%, while the part-time gap runs the other way at negative 2.9% (Office for National Statistics, 2025).
The BLS figure is an unadjusted median of weekly earnings across all full-time workers. The ONS figure is an hourly measure from a payroll survey. Neither compares women with their male counterparts doing the same job.
Adjusted Versus Unadjusted Disclosure
- Apple discloses statistically adjusted pay equity but not unadjusted median pay gaps, a gap in disclosure raised in shareholder proposals filed with the regulator (US Securities and Exchange Commission, Form PX14A6G, FY2024).
The distinction is the whole argument. An adjusted figure compares people in the same role at the same level, and most large employers report it at or near parity. An unadjusted median compares everyone, which is where the disparity shows up, because it reflects who holds the senior jobs.
Women in Tech Leadership and Retention
The metaphor most people reach for is the glass ceiling. The data points somewhere lower down, and it has pointed there for eleven straight years.
The Broken Rung to Manager
The step that narrows the pipeline is the first one, and closing it later is arithmetically impossible.
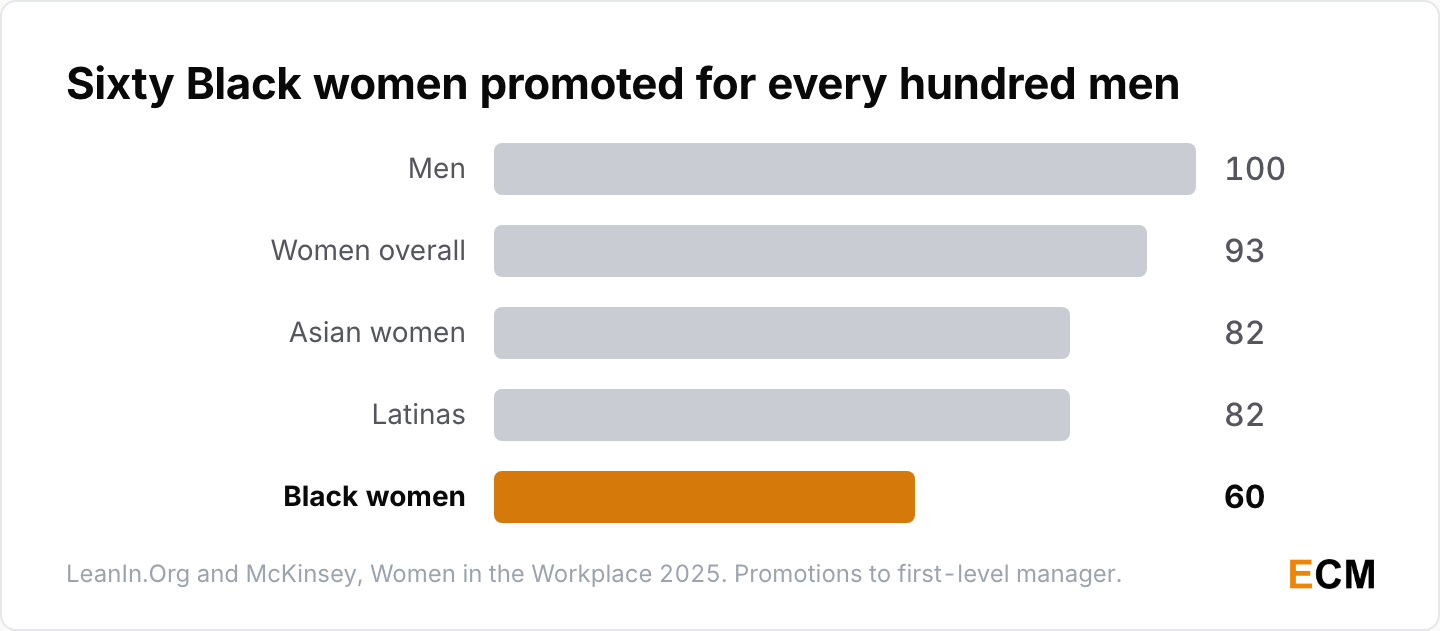
- For every 100 men promoted from entry level to manager, 93 women are promoted (LeanIn.Org and McKinsey, Women in the Workplace 2025, October 2025).
- The same measure gives 82 for Asian women, 82 for Latinas and 60 for Black women (Women in the Workplace 2025).
- Women hold 29% of C-suite roles, flat against 2024 (Women in the Workplace 2025), and 28.8% of management positions globally (World Economic Forum, 2025).
- The study drew pipeline data from 124 organizations employing roughly 3 million people, surveyed 9,500 employees and interviewed 62 HR leaders, in its eleventh consecutive edition (Women in the Workplace 2025).
The Promotion Ambition Gap
The 2025 edition recorded the first measurable ambition gap in the series, and the shape of it is worth arguing with.
- 80% of women want a promotion, against 86% of men (Women in the Workplace 2025, October 2025).
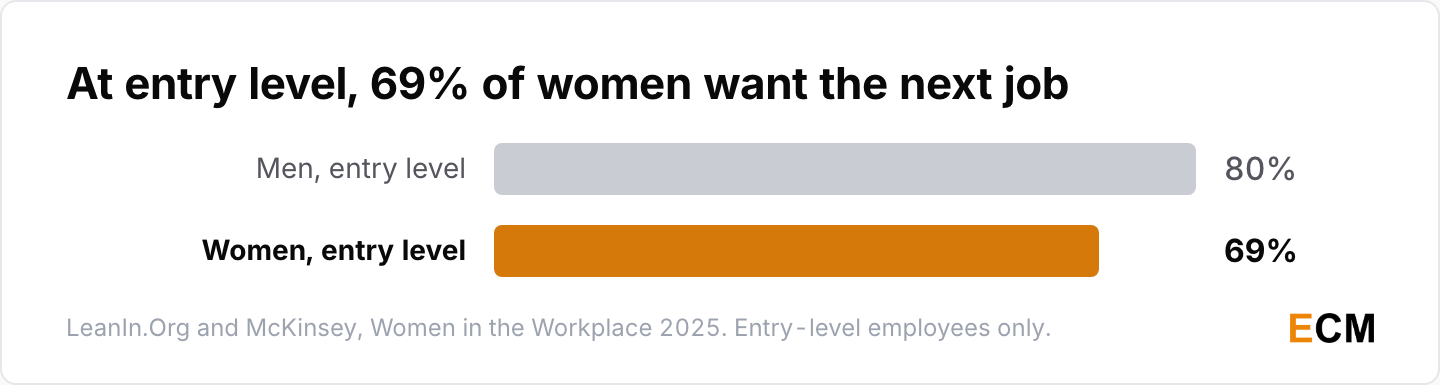
- At entry level the gap widens: 69% of women want a promotion, against 80% of men (Women in the Workplace 2025).
I’d be careful with that framing. An ambition gap measured after a decade of watching the broken rung is not obviously a statement about ambition. It might be a statement about what women expect the promotion to actually deliver.
What Separates the Best Companies
The aggregate barely moves because the average hides two very different groups of employers.
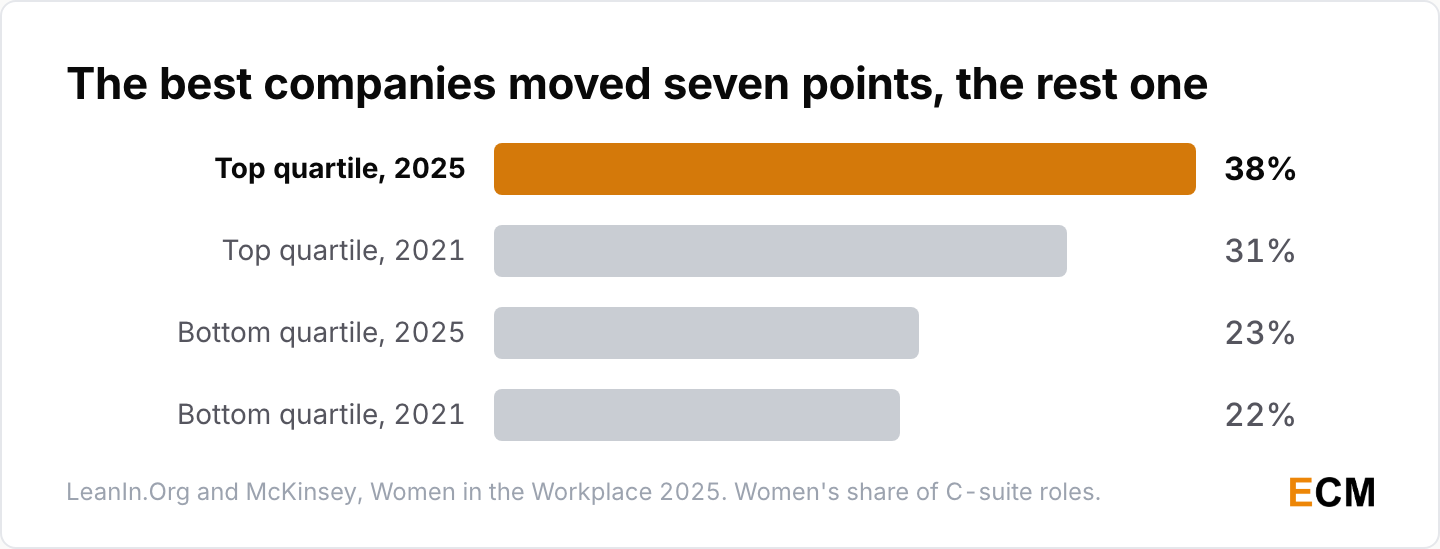
- Companies in the top quartile lifted women’s share of the C-suite from 31% in 2021 to 38% in 2025, while the bottom quartile went from 22% to 23% (Women in the Workplace 2025).
- Only about half of companies now say advancing women is a high priority, down year over year, and at least one in six cut diversity staff or resources in the past year (Women in the Workplace 2025).
- Companies in the top quartile for board gender diversity are 27% more likely to outperform financially than those in the bottom quartile (McKinsey, Diversity Matters Even More, December 2023).
That last one is a correlation. McKinsey says so in the report, and academic re-runs of earlier editions did not hold up.
Attrition and the Layoff Record
Retention data is the thinnest part of this field, because the one benchmark that measured technical women specifically has paused.
- Women’s representation in technical roles dropped 29% between entry level and executive level across participating employers, and attrition among technical women more than doubled in 2022 against the previous year (AnitaB.org, Top Companies for Women Technologists, 2022 results).
- At employers with fewer than 1,000 technical staff, technical women’s representation fell more than 21% between March 2020 and the 2023 measurement (AnitaB.org, 2023 results).
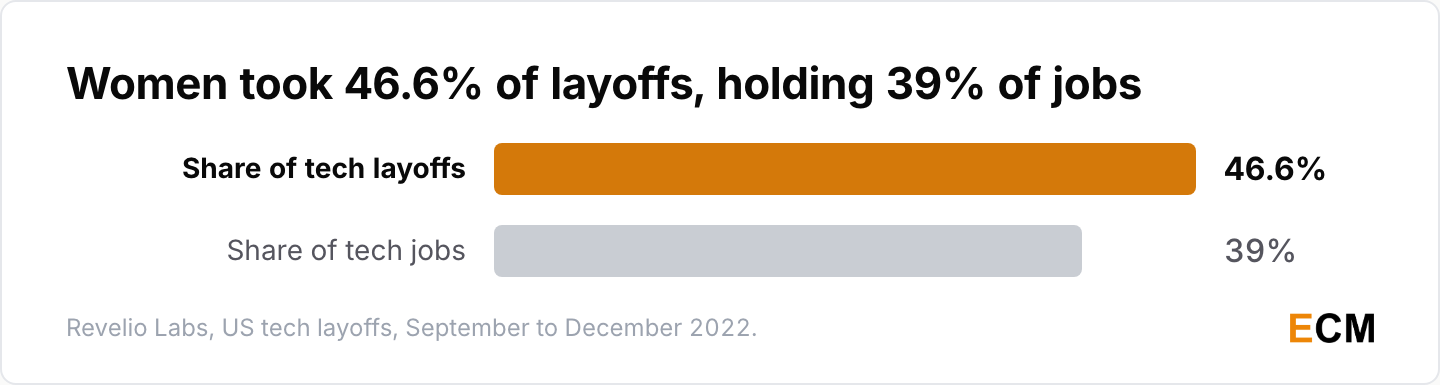
- Women made up 46.6% of tech workers laid off between September and December 2022 while holding about 39% of tech jobs, according to Revelio Labs’ analysis of that cycle (contemporaneous reporting, January 2023).
AnitaB.org has paused the Top Companies program pending an internal review, so 2023 is the last set of results, and nothing has replaced the one benchmark that measured the technical workforce rather than whole-company headcount. The layoff figure covers four months of one cycle in 2022, and more than 300,000 tech layoffs later, nobody has published an equivalent gender breakdown.
Women, AI, and the Adoption Gap
AI is the newest ground in this field, and the research moved fast through 2025 and 2026.
Women Building AI Systems
There is no single defensible answer to “what percentage of AI researchers are women”, because the three best sources count three different groups.
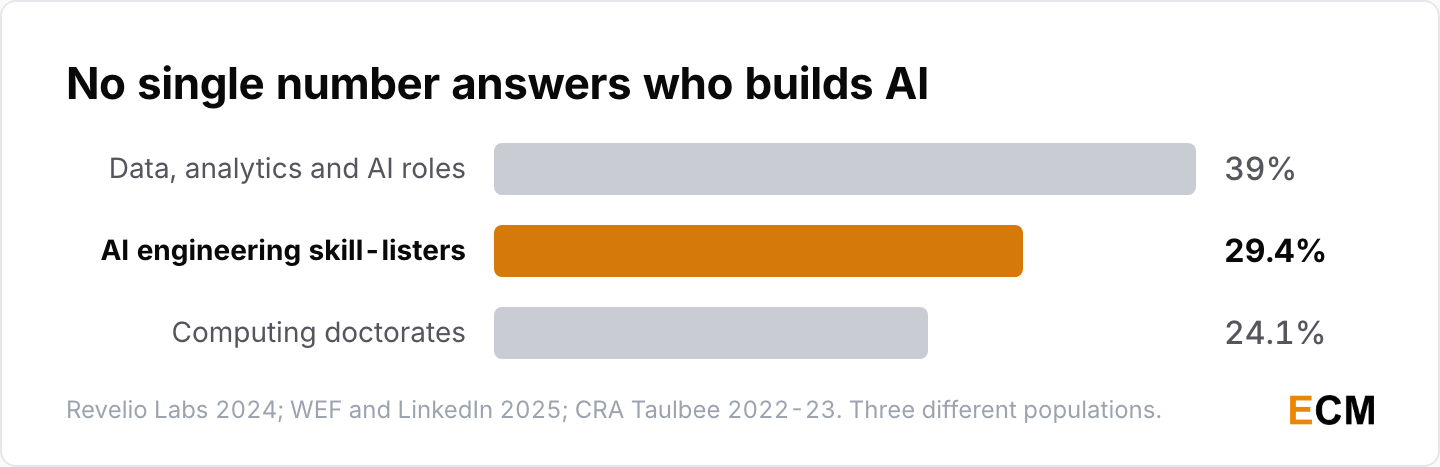
- Women are 29.4% of the people listing AI engineering skills on LinkedIn in 2025, up from 23.5% in 2018 (World Economic Forum and LinkedIn, March 2025).
- Women held 39% of data, analytics and AI roles in 2024, down three percentage points over a decade (Revelio Labs).
- Women were 24.1% of computer science, computer engineering and information doctorate recipients in North America in 2022 to 2023, the closest available proxy for the AI research pipeline (CRA Taulbee Survey).
Anyone quoting one of those three without saying which population it covers is guessing. Stanford’s AI Index no longer publishes a headline number at all.
Workplace AI Adoption by Gender
At work the gap is real, it is narrowing, and the best study on it compares people inside the same job.
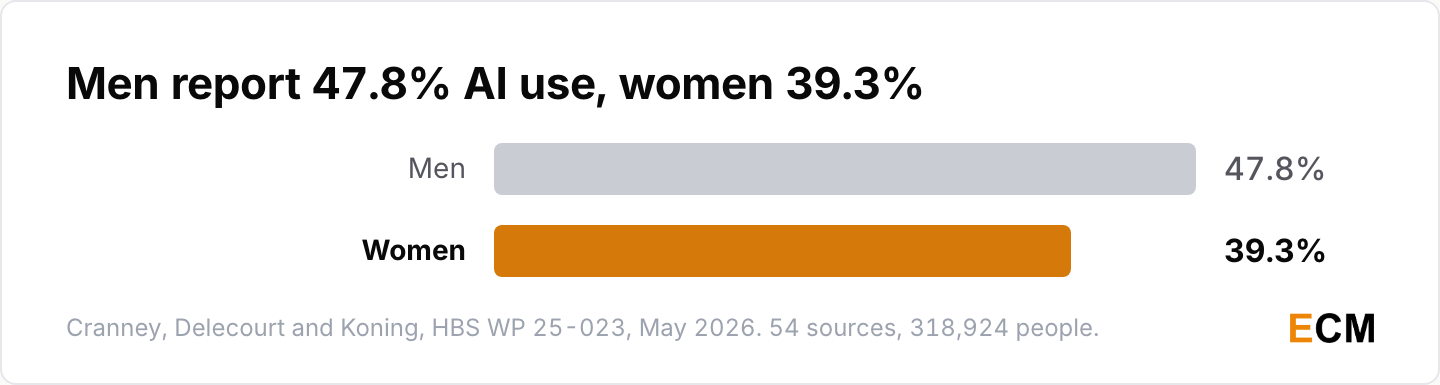
- Pooled across 54 sources, 47.8% of men and 39.3% of women report using AI, a gap of 8.5 percentage points (Cranney, Delecourt and Koning, Harvard Business School, May 2026).
- In relative terms that is a 22% gap, and it has stabilized at roughly 16% since early 2025 (Harvard Business School).
- That synthesis covers 76 sources from more than 100 countries and pools 318,924 respondents (Harvard Business School).
- Women were 16 percentage points less likely than men to have used ChatGPT for work, even within the same occupation doing the same tasks (Humlum and Vestergaard, PNAS, 2025).
- 41% of workers in that study had used ChatGPT for job-related tasks, ranging from 65% among marketing professionals to 12% among financial advisors (Humlum and Vestergaard, PNAS, 2025).
- It drew about 18,000 responses from 100,000 invitations across 11 AI-exposed Danish occupations, surveyed between November 2023 and January 2024 (Humlum and Vestergaard, PNAS, 2025).
- After ChatGPT became publicly available, male researchers’ monthly probability of posting a preprint rose by 0.004 more than female researchers’, equivalent to 6.4%, widening the academic productivity gap (Tang, Li, Hu, Zeng and Du, PNAS Nexus, February 2025).
The Danish study is the one I’d trust most on the workplace question, because it links survey answers to administrative records. Its limitation is that Denmark is a high-equity labour market, so the gap elsewhere is plausibly wider, not narrower.
Consumer AI Use by Gender
Outside work the picture reversed inside eighteen months, which is the single fastest-moving number on this page.
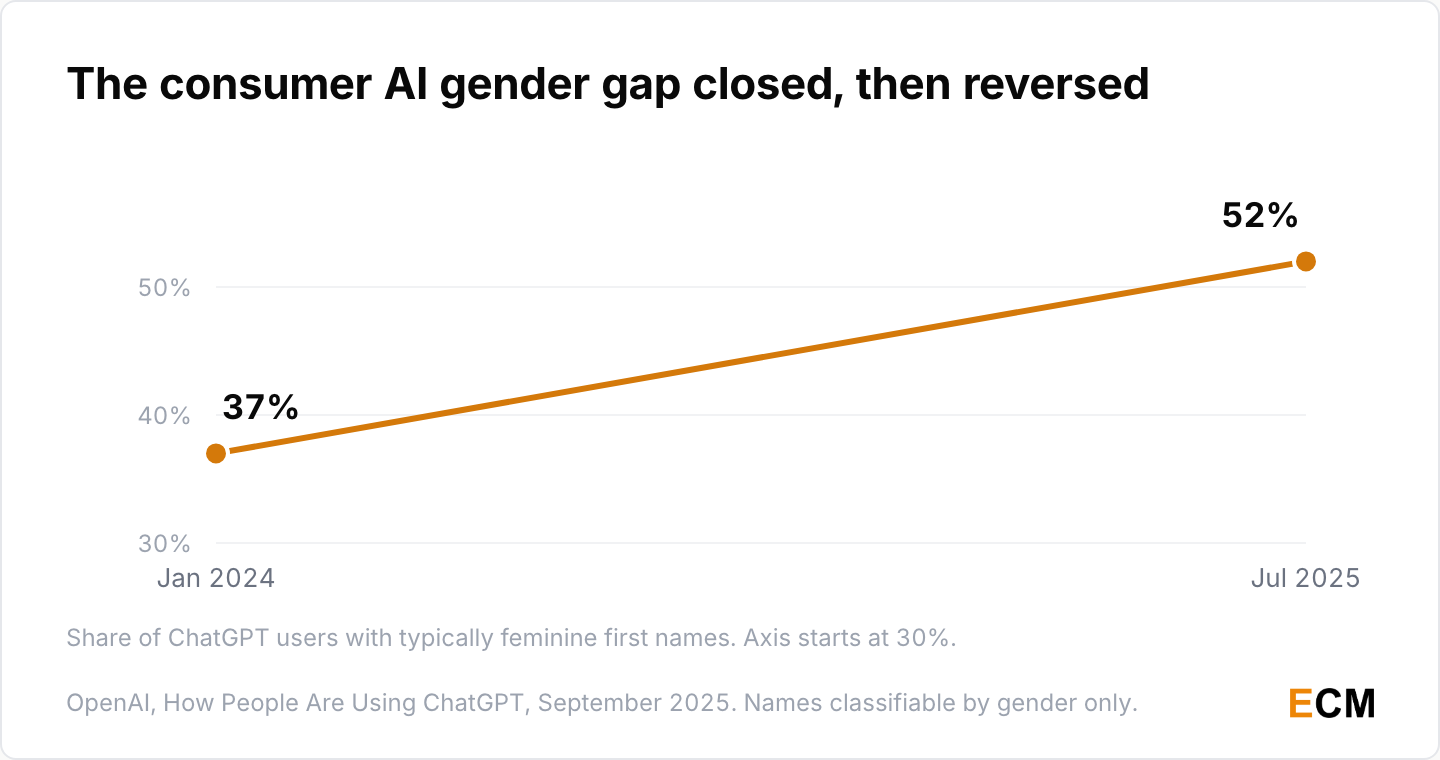
- In January 2024, 37% of ChatGPT users whose first names could be classified had typically feminine names. By July 2025 that share had risen to 52% (OpenAI, How People Are Using ChatGPT, September 2025).
- Around 80% of weekly active users had typically masculine names in ChatGPT’s first months. The underlying analysis covered roughly 1.1 million conversations sampled between May 2024 and June 2025, by which point ChatGPT had around 700 million weekly users (Chatterji et al., NBER Working Paper 34255).
Six of the seven authors on that paper list an OpenAI affiliation, and gender is inferred from first names rather than reported. It is still the largest published look at who uses a consumer AI product.
Women in STEM Education and Hiring
Women earn about a quarter of computing degrees and hold about a quarter to a third of technical roles, so the education numbers explain a lot of the workforce numbers. They do not explain the leadership numbers.
Computing Degrees Awarded to Women
Three degree levels, three different trends, and the most quotable one is going backwards.
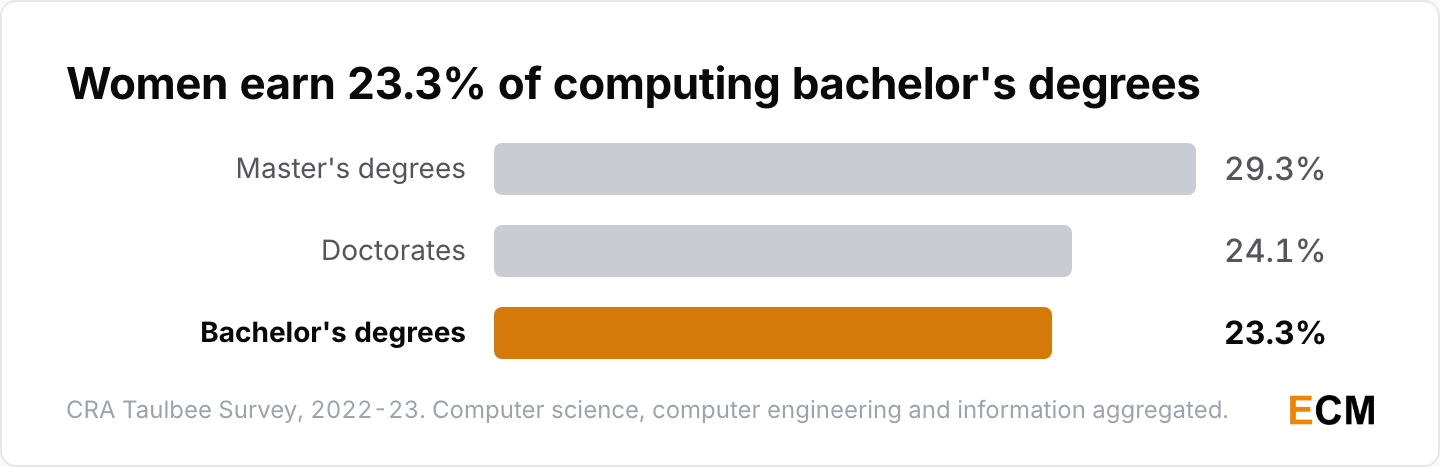
- Women earned 23.3% of bachelor’s degrees in computer science, computer engineering and information in 2022 to 2023, up from 22.7%, and 24.1% of doctorates, up from 22.9% (CRA Taulbee Survey).
- Women earned 29.3% of master’s degrees in those fields, down from 30.9% the previous year (CRA Taulbee Survey).
- In the most recent Taulbee edition, women earned 25.1% of computer science bachelor’s degrees, 23.6% of computer science doctorates and 28.1% of computer science master’s degrees (CRA Taulbee Survey 2025).
- Information degrees are the outlier. Women earned 39.8% of information bachelor’s degrees and 45.5% of information doctorates in that same edition (CRA Taulbee Survey 2025).
The master’s figure is the one people get wrong. It is the highest of the three levels, which makes it the most quotable, and it went down last year rather than up.
AP Computer Science Participation
School-level participation is the one line in this entire dataset that moved steadily in one direction.
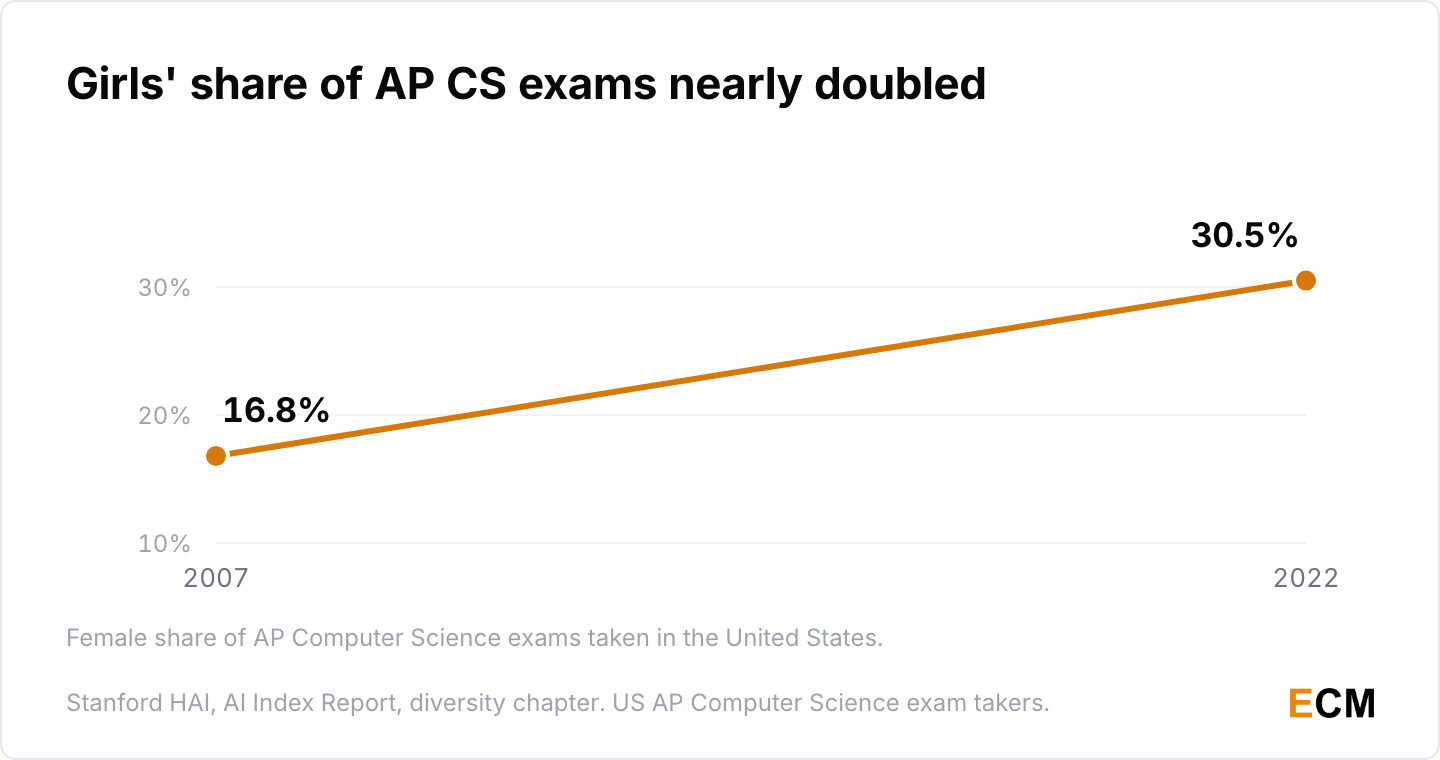
- The share of AP Computer Science exams taken by female students rose from 16.8% in 2007 to 30.5% in 2022 (Stanford HAI, AI Index Report).
- Every surveyed European country reports more male than female graduates in informatics, computer science, computer engineering and IT at bachelor’s, master’s and doctoral level (Stanford HAI, AI Index Report).
Hiring Into AI Roles
The pipeline argument gets harder to make when the newest, best-paid corner of the industry is hiring at half the rate.
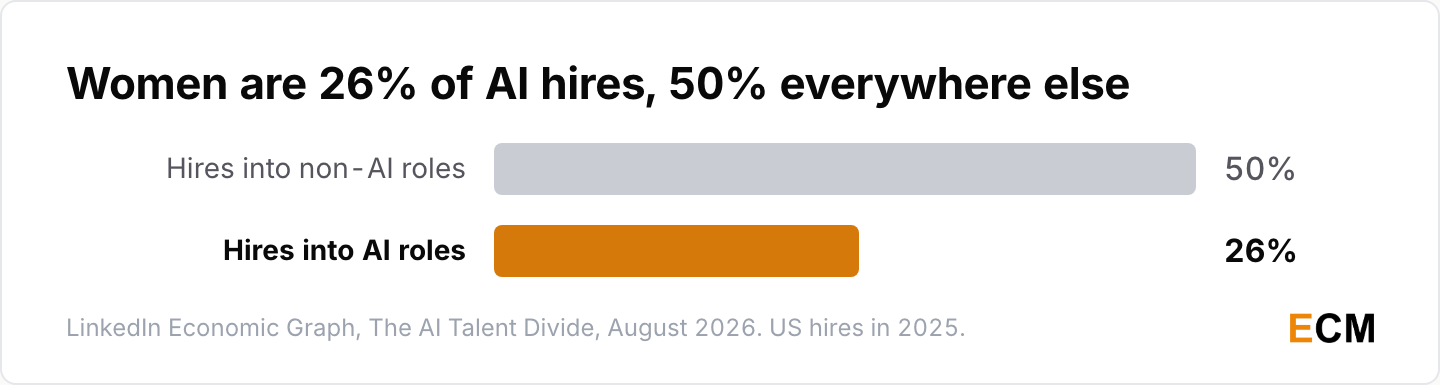
- Women accounted for 26% of US hires into AI roles in 2025, against 50% of hires into non-AI occupations (LinkedIn Economic Graph, The AI Talent Divide, August 2026).
That is the number I’d watch. Degree share moves over decades. Hiring share moves in a year, and right now it is moving the wrong way in the only part of tech that is growing. Who gets hired is only half of it, and the remote work statistics and gig economy statistics roundups cover how the shape of the job itself has changed.
Venture Funding for Women Founders
Two numbers from the same PitchBook report point in opposite directions, which is why only the flattering one travels.
Record Female Founder Funding
The headline is genuinely a record, and almost all of it is concentrated in a handful of AI rounds.
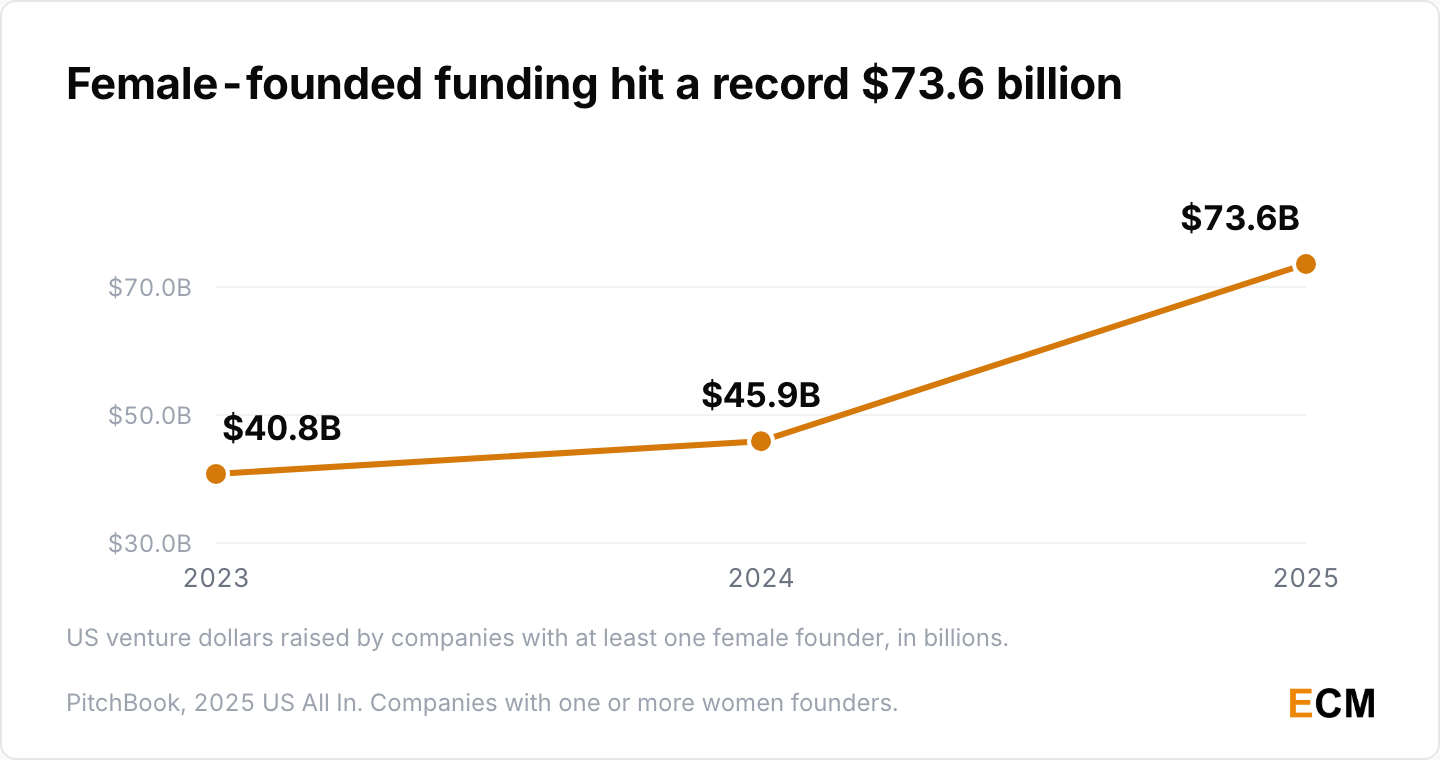
- US companies with at least one female founder raised $73.6 billion in 2025, against $45.9 billion in 2024 and $40.8 billion in 2023 (PitchBook, 2025 US All In, March 2026).
- That was 27.7% of total US venture deal value, up from 19.9% in 2024, an all-time high (PitchBook, 2025 US All In).
- Roughly two thirds of every venture dollar that went to a female-founded company went to an AI company, and more than $30 billion of the total came from two companies, Scale AI and Anthropic (PitchBook, 2025 US All In).
- Mira Murati’s Thinking Machines Lab raised a $2 billion seed round in July 2025 at a $12 billion valuation, a record for the stage (contemporaneous reporting, July 2025).
All-Female Teams Funding Share
Strip out the mixed teams and the record disappears.
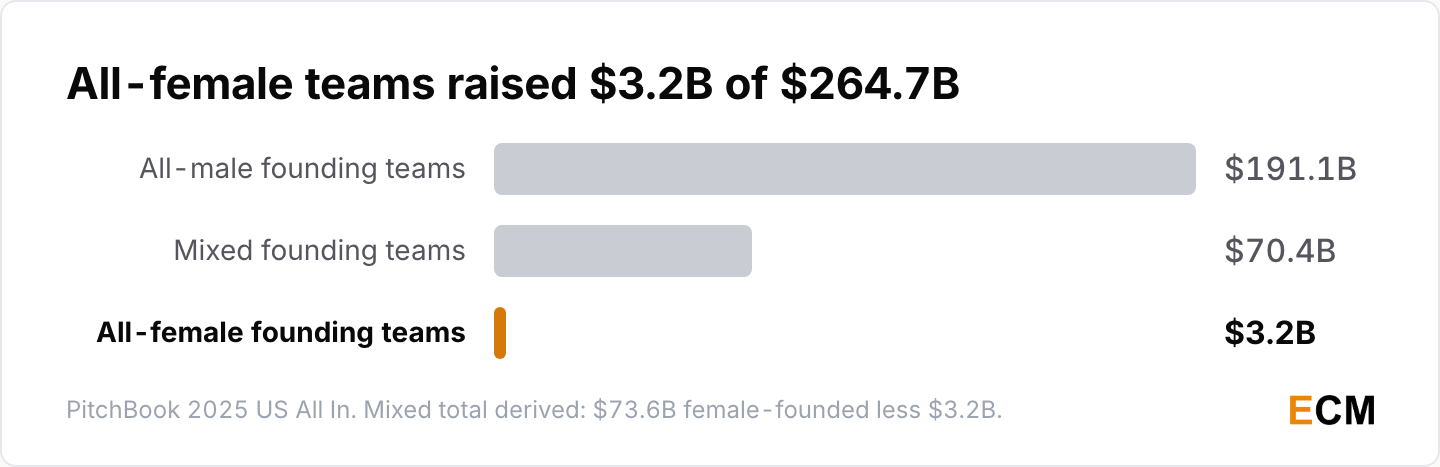
- All-female founding teams raised $3.2 billion across 794 deals, while all-male teams raised $191.1 billion across 10,048 deals (PitchBook, 2025 US All In).
- Mixed founding teams therefore account for $70.4 billion, the remainder of the female-founded total, and the three categories together come to $264.7 billion (PitchBook, 2025 US All In).
- All-male teams raised 21% more year over year. All-female teams raised 22% less (PitchBook, 2025 US All In).
- 82% of partners, principals and managing directors at US venture firms with at least $50 million under management are men (PitchBook, 2025 US All In).
“Female-founded” counts a company with one woman and three men among its founders. Teams of women alone took about 1.2% of that $264.7 billion, which is the half of the story that never gets quoted.
If you follow startup funding generally, the concentration pattern here is the same one running through the whole market. I’ve written up the broader picture in the investment statistics and startup statistics roundups.
Frequently Asked Questions
How Many Women Are in the Tech Industry?
There isn’t one number, and the honest answer names the population first. Women are 35% of the US STEM workforce, 28.2% of the global STEM workforce, 19.5% of EU ICT specialists, and 27.2% of technical roles at Microsoft. They differ because they count different people, not because one is wrong.
What Is the Gender Pay Gap in Tech?
The defensible figures are national rather than sector-specific. US women in full-time work earn 83 cents for every dollar men earn, a 17% median gap (US Bureau of Labor Statistics, 2024). In the UK the full-time gap is 6.9% and the all-employee gap is 12.8% (Office for National Statistics, 2025). Sector-level tech figures mostly come from vendor surveys with self-selected samples.
What Percentage of Women in Tech Are in Leadership?
Women hold 29% of C-suite roles in corporate America (LeanIn.Org and McKinsey, 2025) and 28.8% of management positions globally (World Economic Forum, 2025). In data, analytics and AI specifically, women hold about 29% of senior leadership (Revelio Labs). The tighter constraint sits earlier: 93 women promoted to manager per 100 men, and 60 for Black women.
Are Women Using AI Less Than Men?
At work, yes. Pooling 54 sources covering 318,924 people, 47.8% of men and 39.3% of women report using AI (Harvard Business School, 2026), and a Danish study found women 16 percentage points less likely to use ChatGPT for work than men in the same occupation (PNAS, 2025). Outside work the gap closed: 37% to 52% between January 2024 and July 2025 (OpenAI, 2025).
What Share of Venture Funding Goes to Women Founders?
Companies with at least one woman among the founders took 27.7% of US venture deal value in 2025, a record $73.6 billion. Teams made up entirely of women took $3.2 billion, about 1.2% of the market (PitchBook, 2025 US All In, 2026). The two numbers describe the same year and are both accurate, which is why the first travels and the second doesn’t.
Why Are Big Tech 2026 Figures Missing?
Because the companies stopped publishing them. Google’s last diversity report covers 2024, Microsoft’s covers 2024, and Meta’s last standalone report is the 2022 edition. Any 2026 figure for those firms is either an older number relabelled or an outside estimate inferred from public profiles.
Written by
Editorial Staff
The Editorial Staff represents the writers, editors, and content creators who have worked (or work) at Elite Content Marketer. The experimenter-in-chief behind the team is Chintan Zalani, who has close to a decade of experience trying to make sense of the content marketing industry. Started in 2019, Elite Content Marketer is on a mission to help creators build sustainable businesses.
Related Articles

Marketing Data
58 AI Personalization Statistics for 2026: ROI + Adoption
58 AI personalization statistics for 2026: 78% of marketers can’t make enough personalized content, and 87% of brands rate it good while 29% of consumers agree.
Oct 2, 2026Read more →
Marketing Data
60 AI Workflow Automation Statistics for 2026
60 AI workflow automation statistics for 2026: 37% of respondents see any EBIT impact from AI, 6% are high performers, and agents scale at big firms.
Oct 1, 2026Read more →
Marketing Data
AI Image Generation Statistics 2026: 60 Data Points
60 AI image generation statistics for 2026: people now create more than 3 billion images a week with ChatGPT Images and OpenAI’s API.
Sep 30, 2026Read more →