The 2026 marketing technology landscape holds 15,505 tools and grew 0.79%, the year the curve finally flattened (chiefmartec and MartechTribe, 2026). These martech statistics cover vendor counts, budgets, stack size, AI adoption and what agents return.
62 Martech Statistics 2026: Stack Size to ROI
 Written by Editorial Staff
Key Takeaways
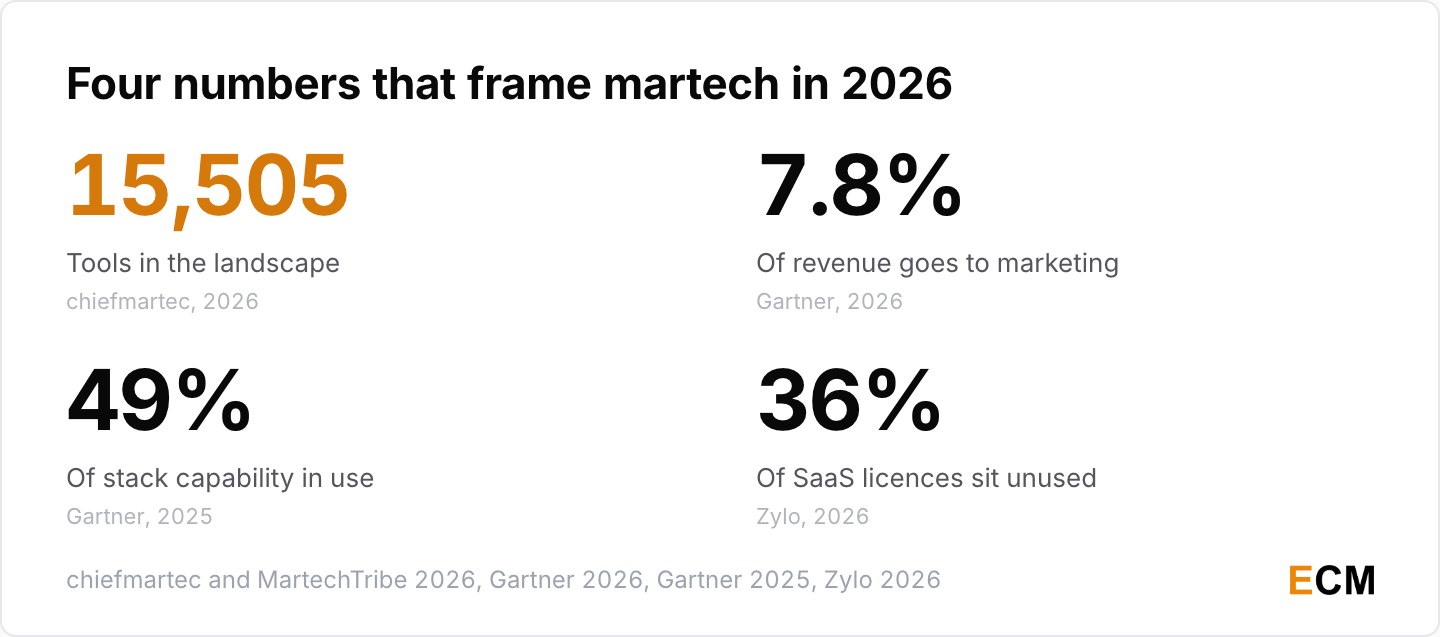
- The landscape holds 15,505 tools, up just 0.79% on 2025, after fourteen years of double-digit growth (chiefmartec and MartechTribe, 2026).
- Marketing budgets sit at 7.8% of company revenue, and 15.3% of that budget now goes to AI (Gartner, 2026).
- AI runs 24.2% of marketing activities, nearly double the 13.1% of 2024 (The CMO Survey, 2026).
- Martech utilization has dropped to 49%, and 15% of organizations count as high performers (Gartner, 2025).
- Organizations leave an average 36% of their SaaS licences unused (Zylo, 2026).
- 45% of martech leaders running AI agents say vendor capability misses expectations, while 89% still expect real benefit (Gartner, 2025).
- UK marketers revised budgets up at a net balance of +6.9% in the second quarter of 2026 (IPA Bellwether, 2026).
How Big the Martech Market Is
Market size questions start with the vendor census, and this is the first year it stopped climbing. For the content slice, see my content marketing statistics.
Vendor Count Since 2011
Scott Brinker has counted marketing technology vendors every year since 2011. The curve has finally bent.
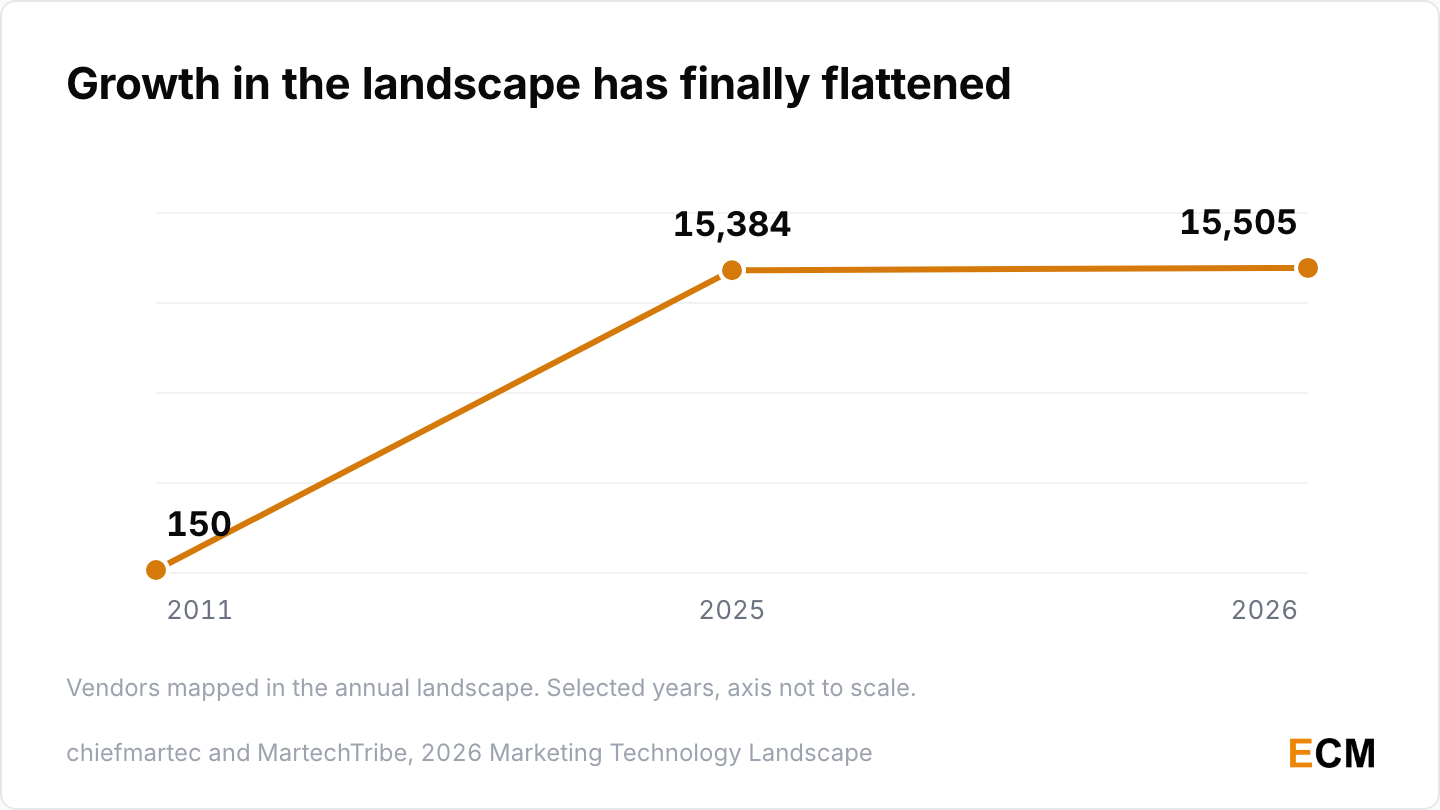
- The 2026 landscape holds 15,505 tools, up 0.79% on the 15,384 counted in 2025 (chiefmartec and MartechTribe, 2026).
- That is still 10,236.7% growth since the 150 tools mapped in 2011 (chiefmartec and MartechTribe, 2026).
- New entrants fell 40%, from 2,489 products added in 2025 to 1,488 in 2026 (chiefmartec and MartechTribe, 2026).
- Removals rose 13% over the same year, from 1,211 to 1,367 (chiefmartec and MartechTribe, 2026).
- 51.7% of the products that exited came from the 2010 to 2019 SaaS wave (chiefmartec and MartechTribe, 2026).
Which Categories Grew and Shrank
Growth moved to the plumbing while the crowded creative categories started shedding products. My SEO statistics roundup covers one of those crowded rooms.
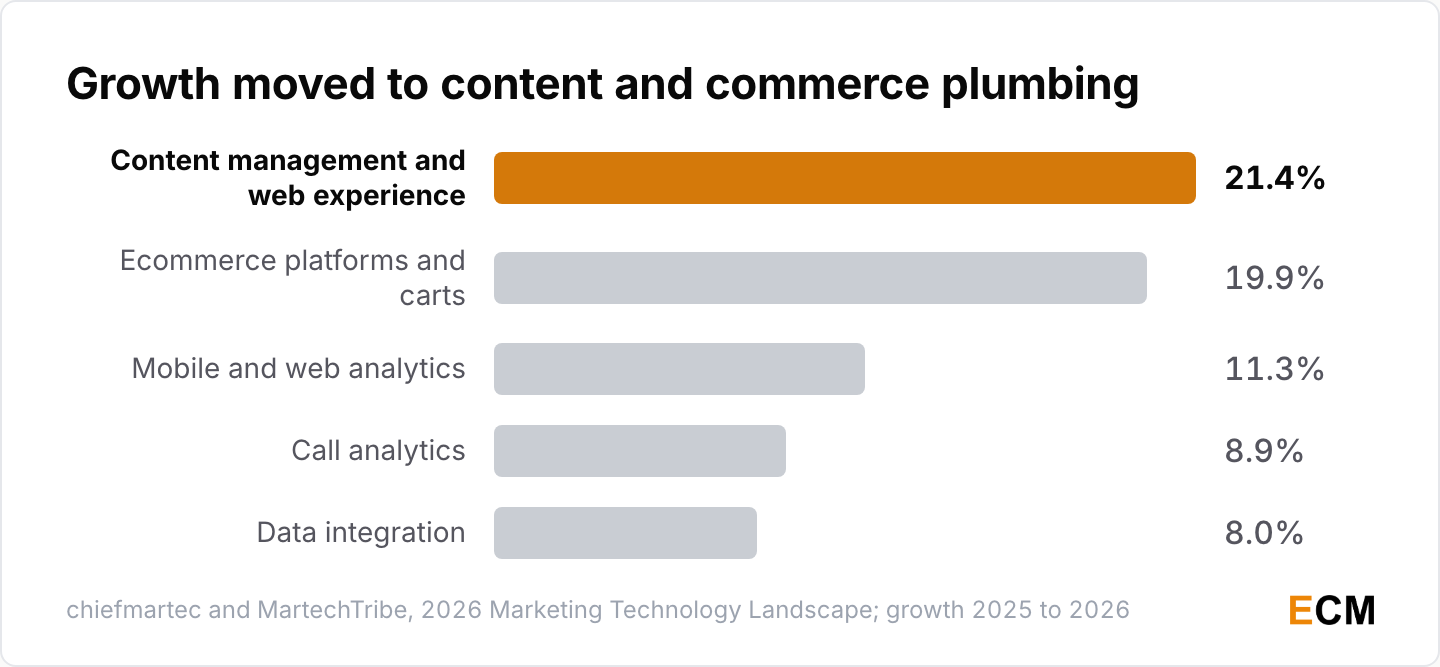
- Content management and web experience grew fastest at 21.4%, from 504 products to 612 (chiefmartec and MartechTribe, 2026).
- Ecommerce platforms and carts grew 19.9%, from 547 to 656 (chiefmartec and MartechTribe, 2026).
- Mobile and web analytics grew 11.3%, call analytics 8.9% and data integration 8.0% (chiefmartec and MartechTribe, 2026).
- Content marketing shrank on net, losing 176 products and gaining 139 (chiefmartec and MartechTribe, 2026).
Money Moving Into Martech
Deal flow is holding, public martech has recovered, and capital keeps picking AI.
- LUMA Partners tracked 469 ad tech and martech transactions across 2025, up 13% on 2024 (LUMA Partners, 2026).
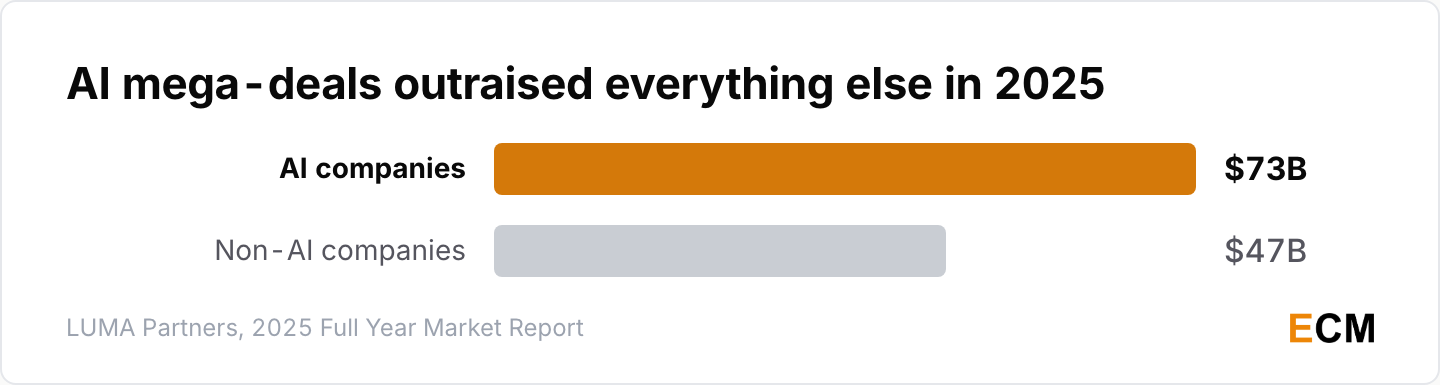
- Mega-deal investment in AI companies reached $73B in 2025, passing the $47B that went to everything else for the first time (LUMA Partners, 2026).
- The LUMA.M martech index rose 9% in the second quarter of 2026 (LUMA Partners, 2026), after falling 18.1% across 2025 (LUMA Partners, 2026).
- Across all private cloud companies, Cloud 100 aggregate value hit $1.117 trillion, up 36% on 2024, with 22 AI names holding 42% of that value (Bessemer Venture Partners, 2025).
Martech Budgets and Spending Share
Budgets are the constraint every stack decision runs into, and AI is now taking a visible slice of them. The same squeeze shows up in my email marketing statistics.
Share of the Marketing Budget
Marketing money is flat, and the growth inside it is going to AI rather than to headcount.
- Marketing budgets rose slightly to 7.8% of company revenue in 2026 from 7.7% in 2025 (Gartner, 2026).
- CMOs allocate an average 15.3% of the marketing budget to AI initiatives (Gartner, 2026).
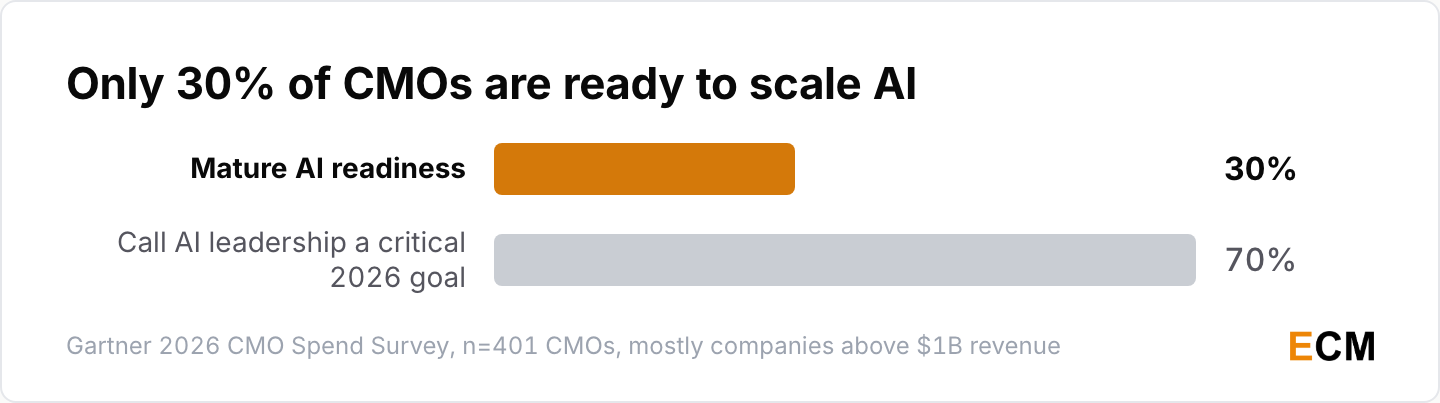
- 70% of CMOs call AI leadership a critical 2026 goal, yet only 30% report mature AI readiness (Gartner, 2026).
- Gartner’s marketing technology page puts martech at nearly 22% of total marketing spend (Gartner, 2026).
- The last martech budget share The CMO Survey published was 19.0%, with those leaders expecting 22.8% within a year and 31.7% within five (The CMO Survey, 2024).
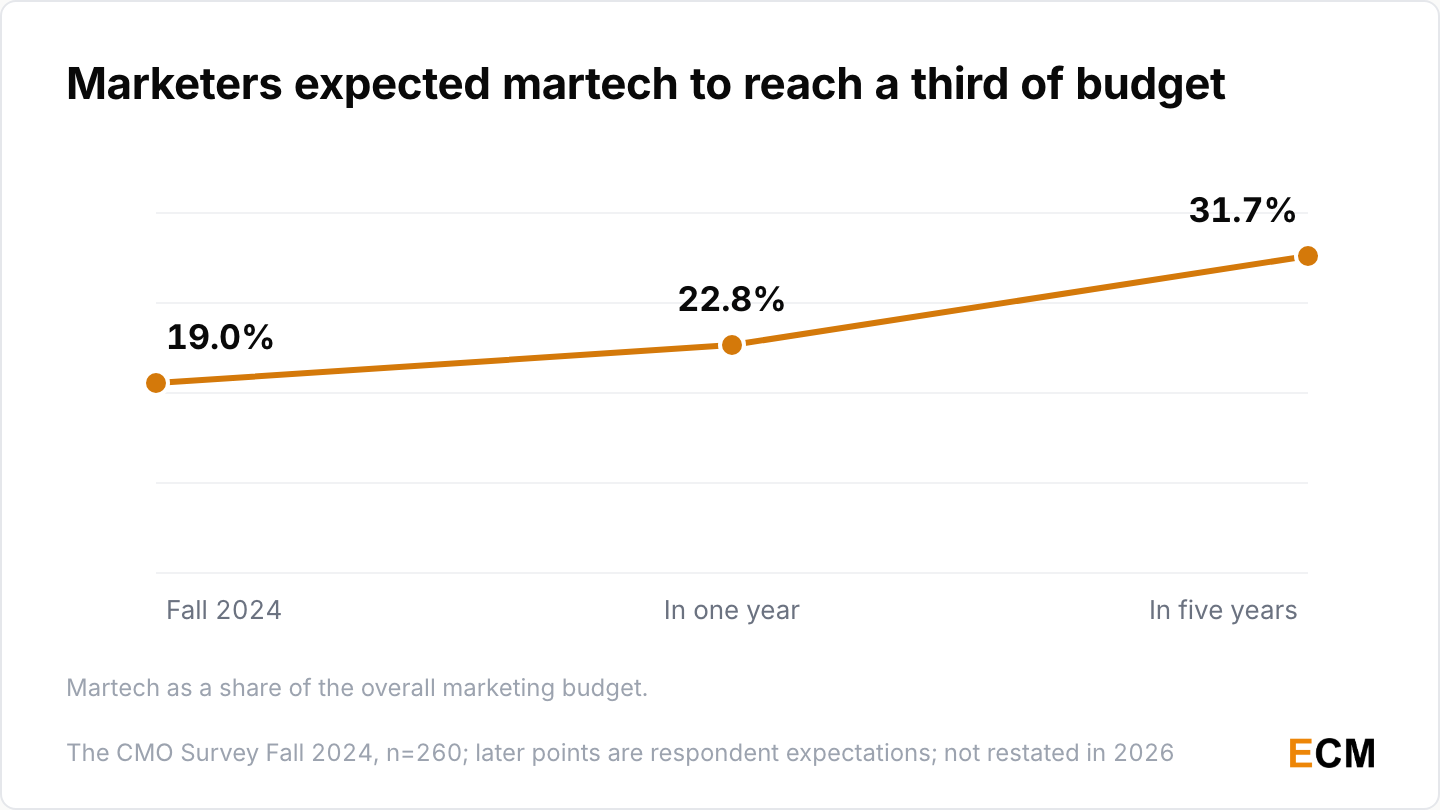
Gartner and The CMO Survey are not interchangeable, which is why their budget readings differ here and again in the next section. Gartner asks 401 CMOs at mostly billion-dollar companies in North America, the UK and Europe. The CMO Survey asks US for-profit firms of every size, and its 2026 edition dropped the martech budget line entirely.
Budget Direction and Pressure
The money is moving up again, and CMOs still say it is not enough.
- The CMO Survey reads it the other way: budgets fell to 9.0% of company revenues and 9.6% of overall budgets, with spending up just 1.7% (The CMO Survey, 2026).
- 56% of CMOs say their organization lacks the budget to deliver the 2026 strategy, and 54% report insufficient resources (Gartner, 2026).
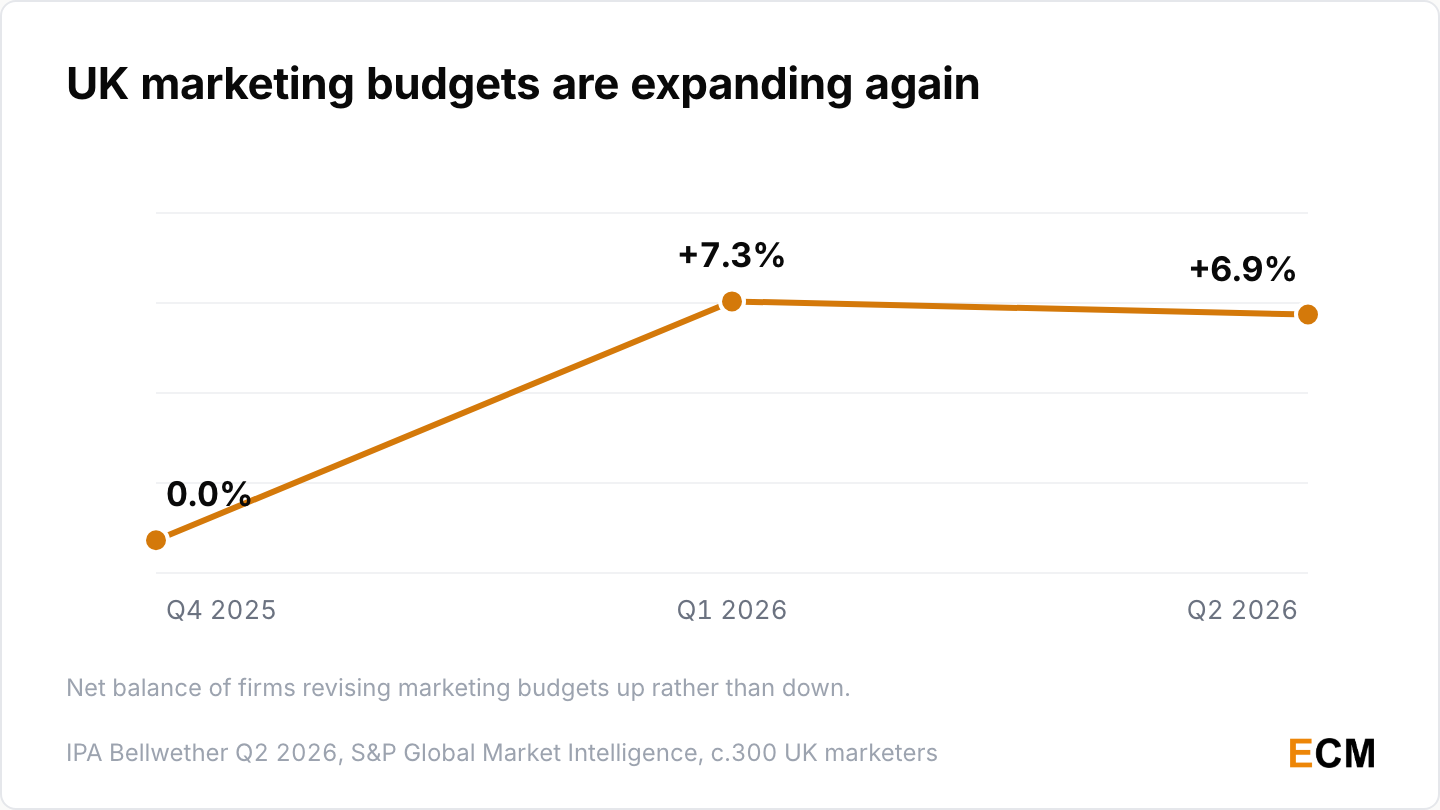
- UK marketers revised budgets up at a net balance of +6.9% in the second quarter of 2026, after +7.3% in the first (IPA Bellwether, 2026).
- 23.8% of UK firms raised budgets against 16.9% that cut them, with 59.4% holding flat (IPA Bellwether, 2026).
- That followed a flat net balance of 0.0% in the fourth quarter of 2025 (IPA Bellwether, 2026).
Stack Size and the Utilization Gap
This is the part of the data I care most about, because it is where the wasted money lives. Marketing tools get bought faster than they get used.
Apps per Company
Portfolios stopped growing in 2026, but the spend behind them did not.
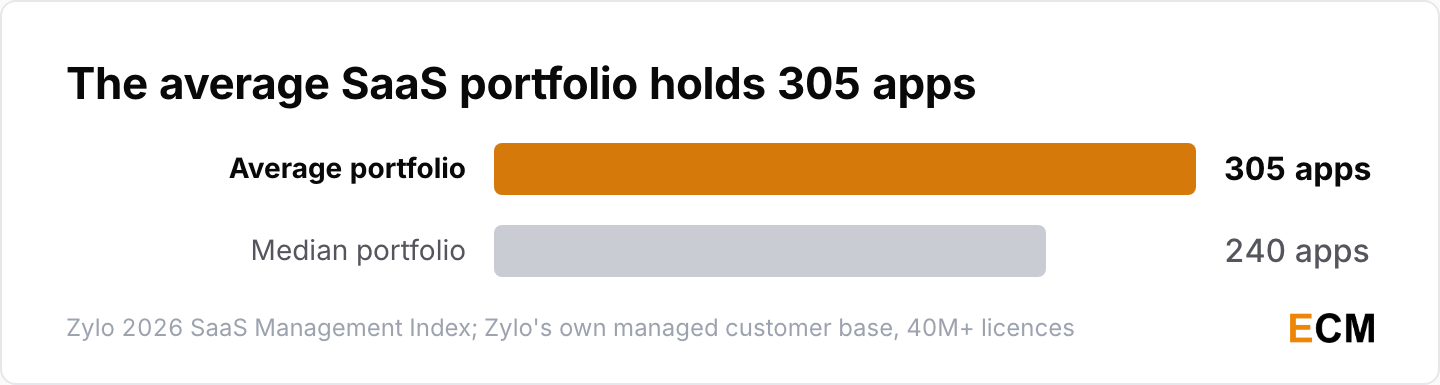
- The average SaaS portfolio holds 305 apps and the median 240 (Zylo, 2026).
- Average annual SaaS spend reached $55.7M, up 8%, against a median of $20.6M (Zylo, 2026).
- Business units now control 81% of SaaS spend, against 15% managed directly by IT (Zylo, 2026).
Those portfolio and spend figures come from Zylo’s own managed customer base of more than 40 million licences, which skews to large enterprises that buy SaaS management software.
Utilization and Wasted Licenses
Gartner calls this a quiet crisis, and the licence data from the SaaS side says the same thing in dollars.
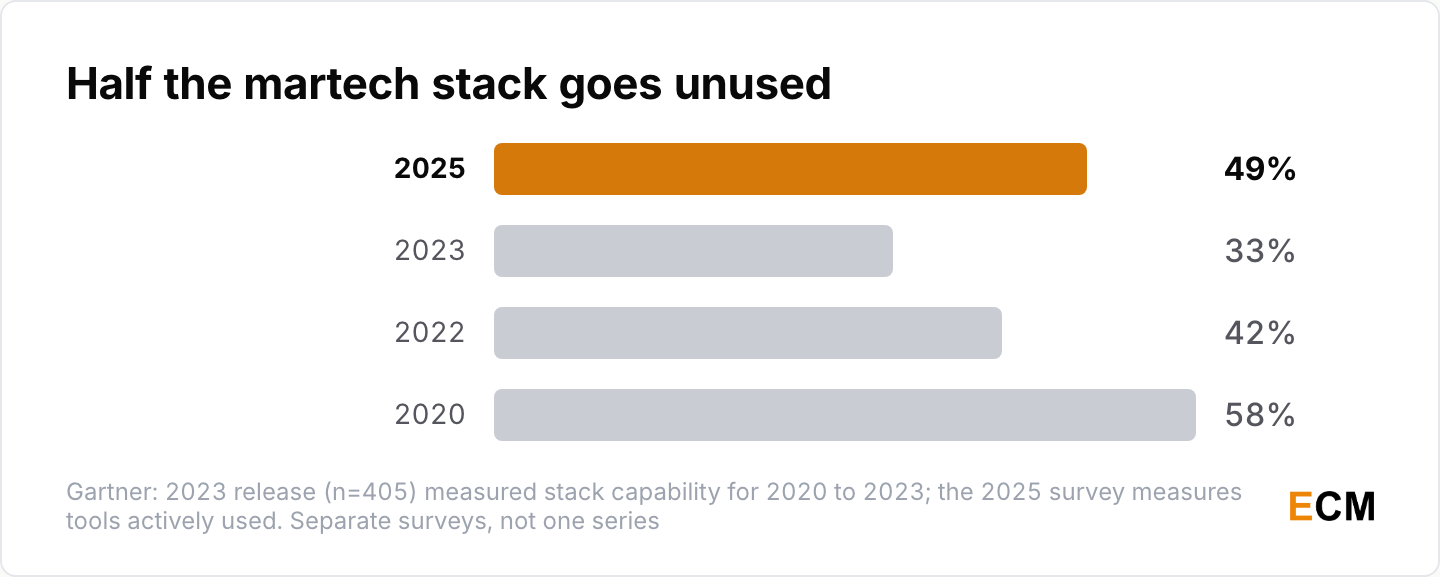
- Gartner says only 49% of martech tools are actively used, and frames that as a drop rather than a recovery (Gartner, 2025).
- An earlier Gartner survey of 405 marketing leaders put stack capability utilization at 33% in 2023, against 42% in 2022 and 58% in 2020 (Gartner, 2023).
- Organizations leave an average 36% of their SaaS licences unused (Zylo, 2026).
- In a separate Zylo survey of 218 IT leaders, 78% reported unexpected charges from consumption-based or AI pricing and 61% cut projects because of them (Zylo, 2026).
- A separate reading from a different survey puts 56.4% of purchased martech tools in use (The CMO Survey, 2024).
The Payoff Gap
Buying the tool is the easy half. The gap between expected and actual payoff is where teams get stuck, and it shows up in the same surveys year after year.
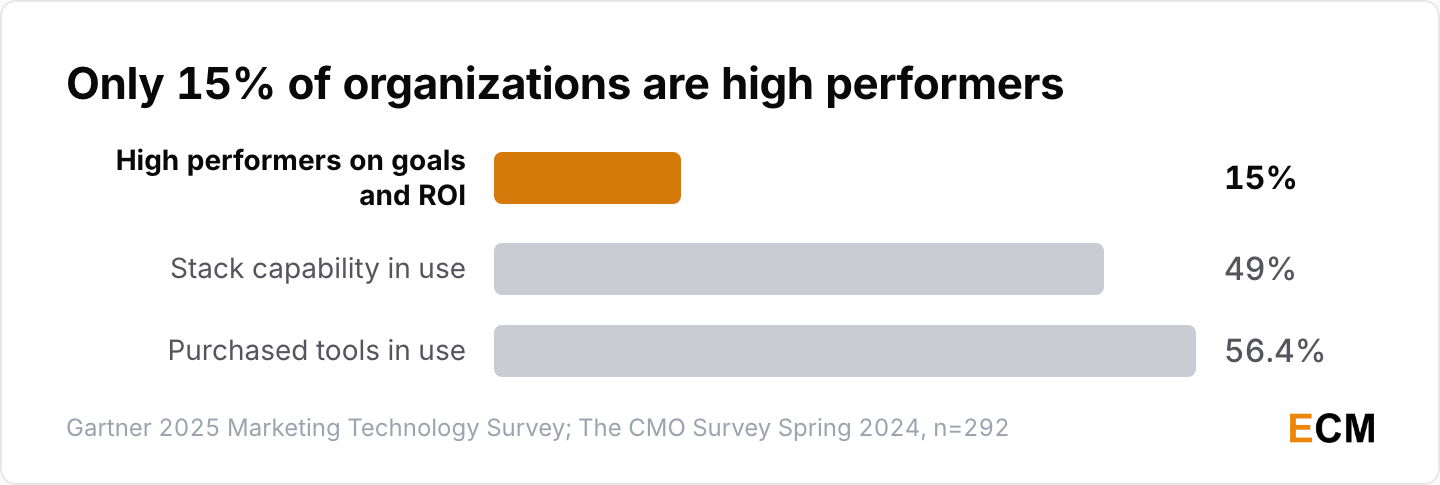
- 15% of organizations clear Gartner’s high-performer bar of meeting strategic goals and showing positive ROI (Gartner, 2025).
- 54.9% of companies reported a gap between actual and expected martech payoff (The CMO Survey, 2024).
AI Adoption Across Marketing Teams
The honest read is that artificial intelligence is everywhere in individual workflows and still thin as a system. My prompt engineering statistics roundup covers the workflow side.
How Much Work Uses AI
Share of activity is the cleanest adoption measure, because it survives the definitional arguments.
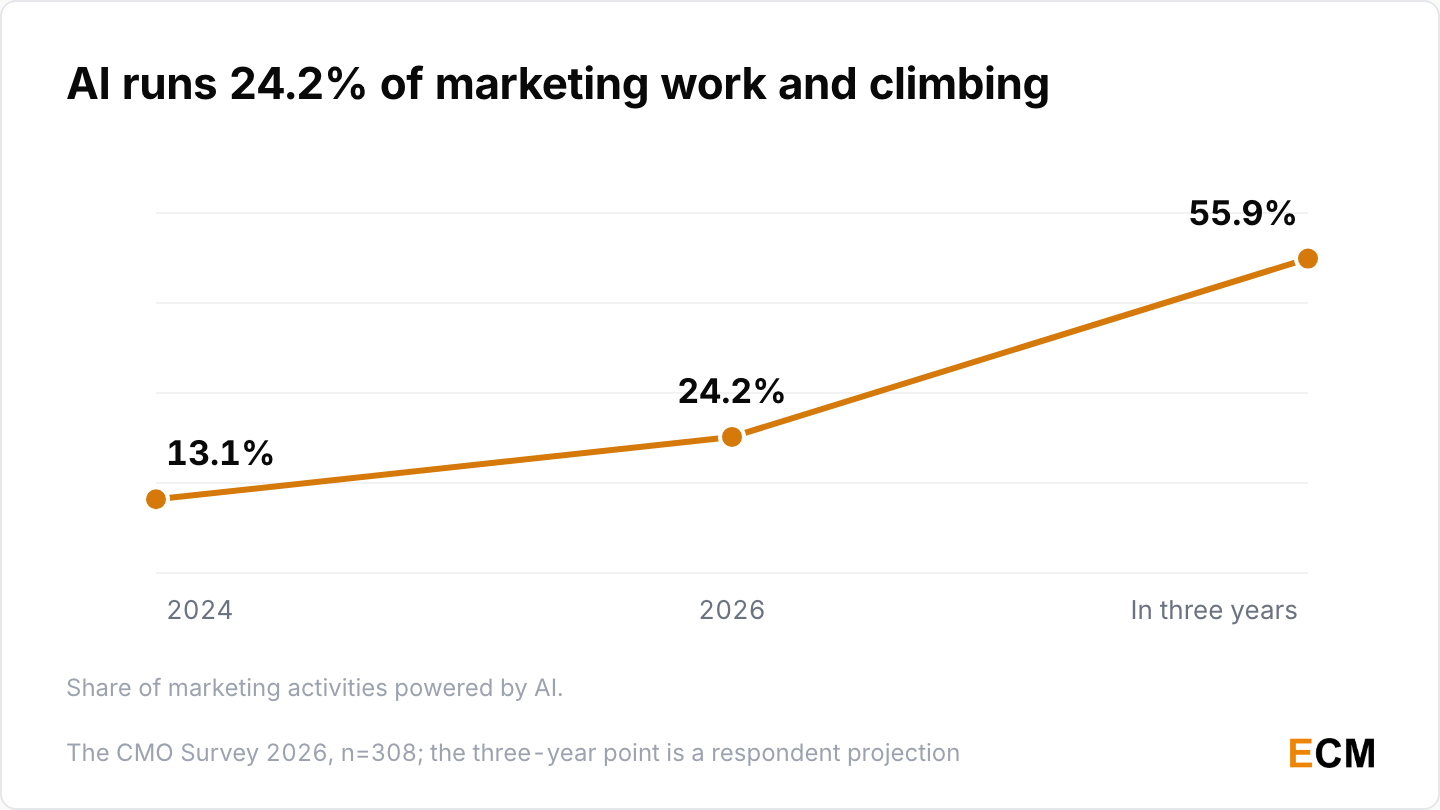
- AI runs 24.2% of marketing activities, up from 13.1% in 2024 (The CMO Survey, 2026).
- Companies project AI will reach 55.9% of marketing activities within three years (The CMO Survey, 2026).
- Generative AI grew 220% over those two years, from 7.0% to 22.4% of activities (The CMO Survey, 2026).
- Generative engine optimization, getting content into AI answers, is already in use at 41.5% of companies (The CMO Survey, 2026).
- Adoption skewed early in 2025: 32.3% of the martech and marketing operations leaders surveyed were in pilot and 39.6% used AI in limited workflows (chiefmartec and MartechTribe, 2025).
What Teams Run AI On
Content production is where adoption runs deepest, and it thins out sharply by the time you reach commerce and sales.
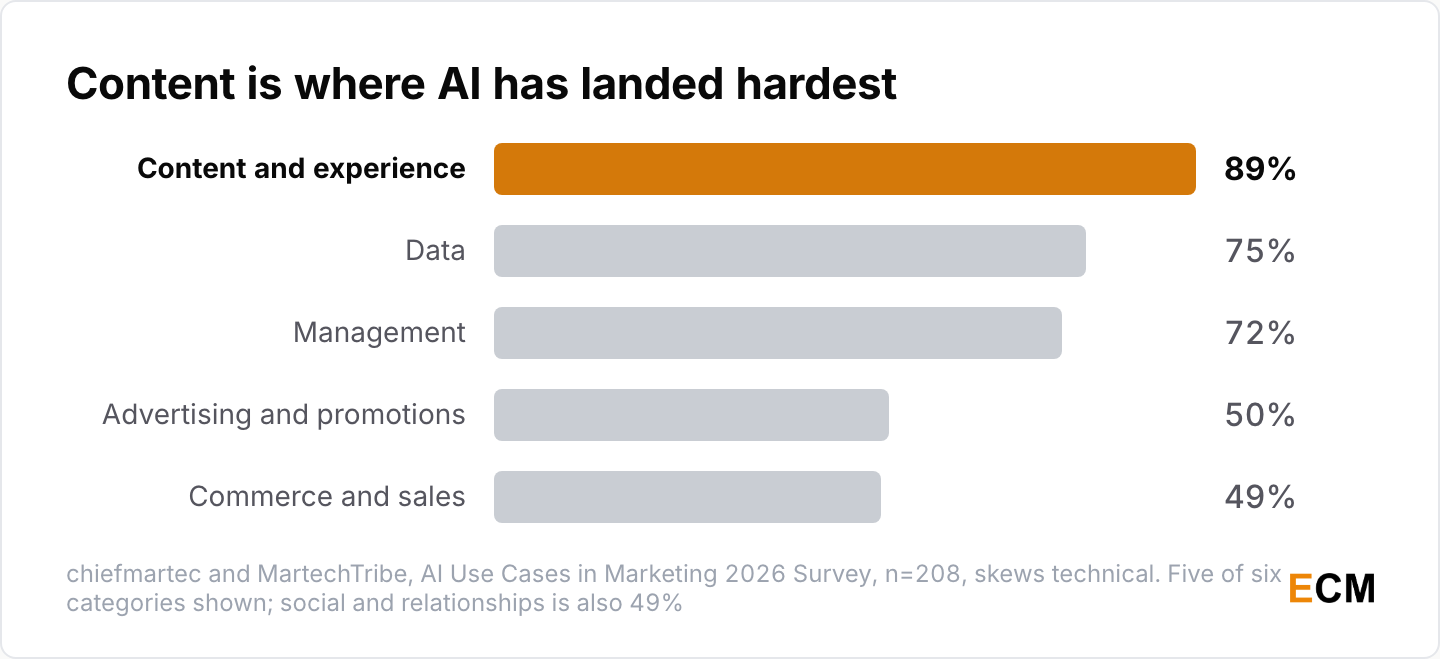
- 89% of the marketers surveyed now use AI somewhere in content and experience, up from 79% in 2024 (chiefmartec and MartechTribe, 2026).
- Data work sits at 75% and management at 72%, while advertising and promotions reached 50%, and social and relationships and commerce and sales both 49% (chiefmartec and MartechTribe, 2026).
- AI copy production has reached 91% adoption, the first marketing use case to go near-universal (chiefmartec and MartechTribe, 2026).
- Content authenticity and AI detection sits at 37%, with 103 of 163 respondents doing nothing to check the AI content they generate (chiefmartec and MartechTribe, 2026).
- Spending on AI-native apps rose 108% year over year, and 393% at large enterprises (Zylo, 2026).
Training and Governance Gaps
The blocker is not the software. It is that nobody taught anyone how to run it.
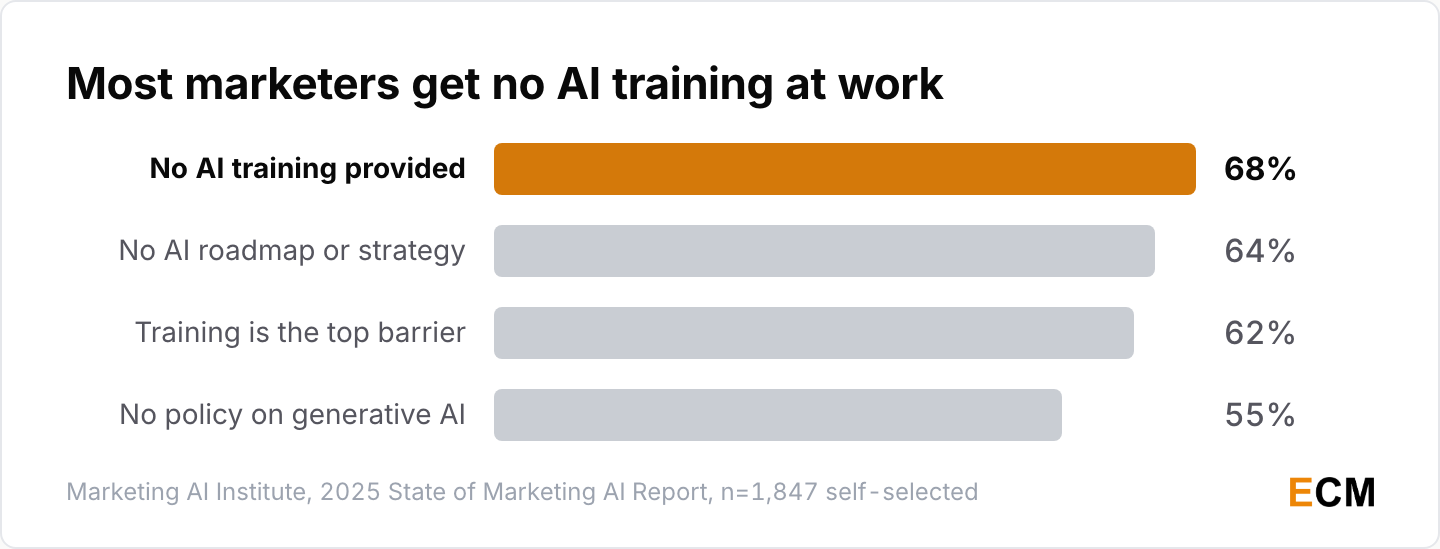
- Lack of education and training is the top adoption barrier for 62% of respondents, the fifth year in a row (Marketing AI Institute, 2025).
- 68% have no AI training provided by their company, counting those where it is still being developed (Marketing AI Institute, 2025).
- 55% say their company has no policy guiding generative AI use, and 64% say their marketing team has no AI roadmap (Marketing AI Institute, 2025).
- 73% of the marketing teams in chiefmartec’s 2026 survey do have a formal generative AI policy (chiefmartec and MartechTribe, 2026).
Those two governance readings come from different rooms. The Marketing AI Institute sample is 1,847 self-selected marketers; chiefmartec’s is 208 martech and marketing operations leaders who skew technical.
AI Agents Versus Vendor Promises
Agentic AI is the loudest category in marketing technology right now, and field results have not caught up with the pitch.
Where Agents Fall Short
Expectation and delivery are moving in opposite directions, which is the single most useful signal in this year’s data.
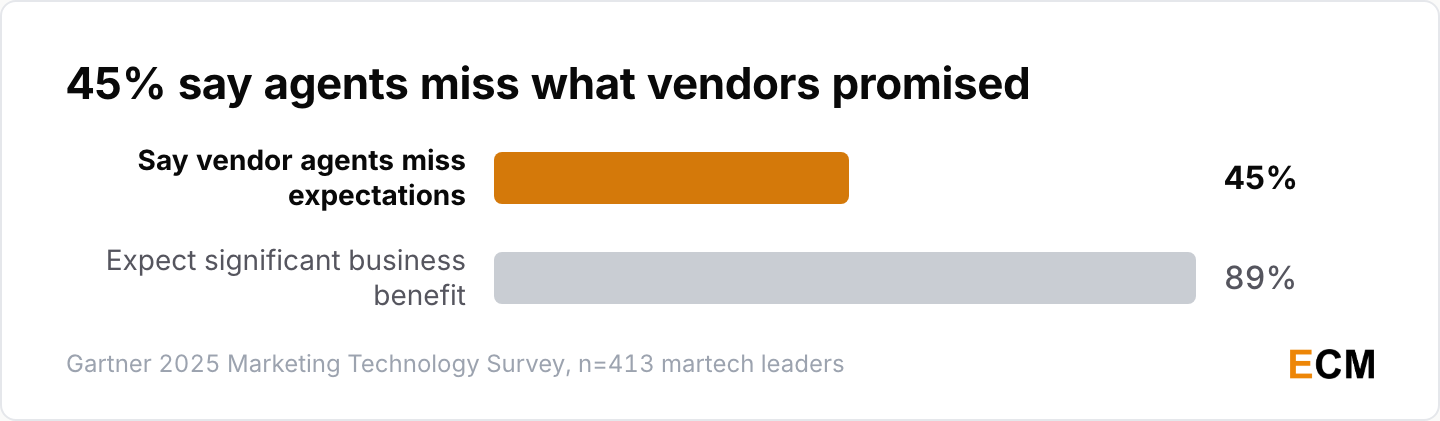
- 45% of martech leaders running agents in pilot or production say vendor capabilities miss their business performance expectations (Gartner, 2025).
- 89% of leaders with agent initiatives still expect significant business benefit from them (Gartner, 2025).
- Half of organizations lack the technical and data stack readiness to deploy agents, and half cite a shortage of technical talent (Gartner, 2025).
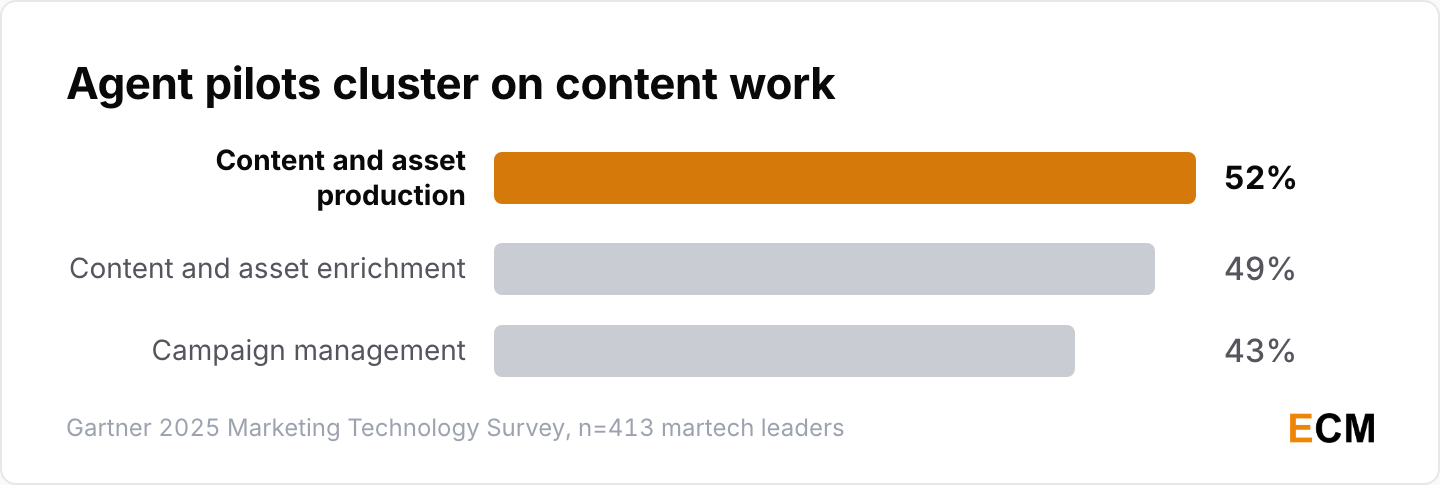
- Pilots concentrate on content and asset production at 52%, asset enrichment at 49% and campaign management at 43% (Gartner, 2025).
What Vendors Are Reporting
Filings are the antidote to survey mush, because a public marketing technology company has to stand behind the number.
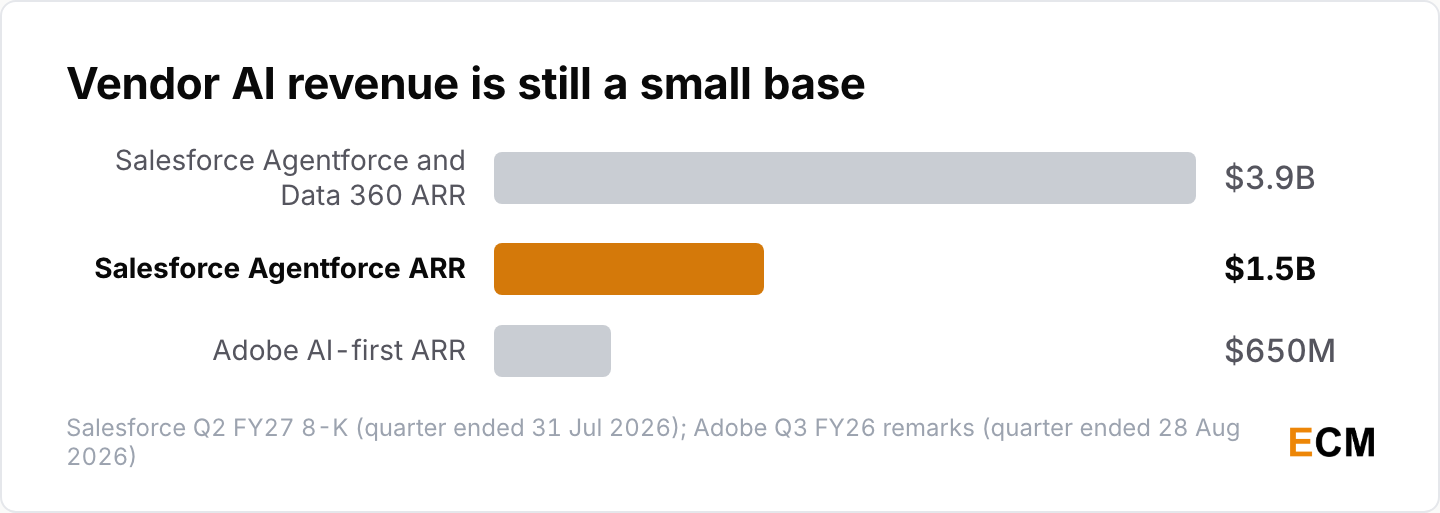
- Salesforce reported Agentforce ARR above $1.5B for the quarter ended 31 July 2026, up over 240% year over year (Salesforce, 2026).
- Agentforce and Data 360 together reached nearly $3.9B in annual recurring revenue, up over 210% (Salesforce, 2026).
- Salesforce has delivered 7.0 billion agentic work units to date, 3.2 billion of them in that quarter (Salesforce, 2026).
- Adobe reported AI-first ending ARR above $650M, growing more than 150% year over year, against total company ARR of $27.50B (Adobe, 2026).
- ZoomInfo reported revenue of $310.4M for the quarter ended 30 June 2026, up 1.2%, with net revenue retention at 89% (ZoomInfo, 2026).
Read the growth rates against their bases. Agentforce ARR is compounding off a product that did not exist two years ago, and Salesforce folded Slackbot and Headless 360 into the metric this quarter. Adobe’s AI-first ARR is a narrower measure than the AI-influenced label it used to lead with.
What Sits at the Stack Center
Architecture questions used to be settled. They are open again, and the warehouse is the reason.
Core Platforms by Company Type
The CRM held the center in B2B marketing, and the warehouse has already passed the customer data platform.
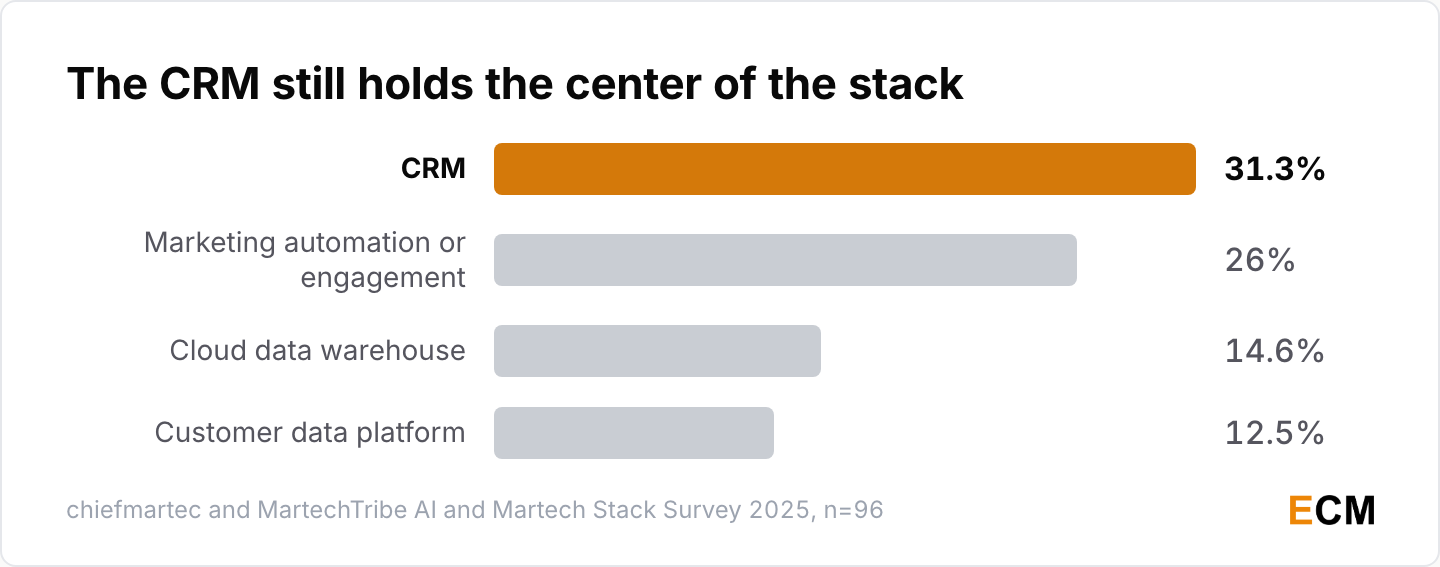
- 31.3% of the martech leaders surveyed named a CRM as the center of their stack, then a marketing automation or engagement platform at 26% (chiefmartec and MartechTribe, 2025).
- A cloud data warehouse came third at 14.6%, ahead of a customer data platform at 12.5% (chiefmartec and MartechTribe, 2025).
- In B2B, 42% put the CRM at the center against 8% of pure B2C businesses (chiefmartec and MartechTribe, 2025).
Those readings come from a survey of 96 martech and marketing operations leaders, a sample the report itself says skews toward more advanced professionals.
Warehouse and Data Integration
The warehouse is becoming the real center for first-party customer data at the largest teams.
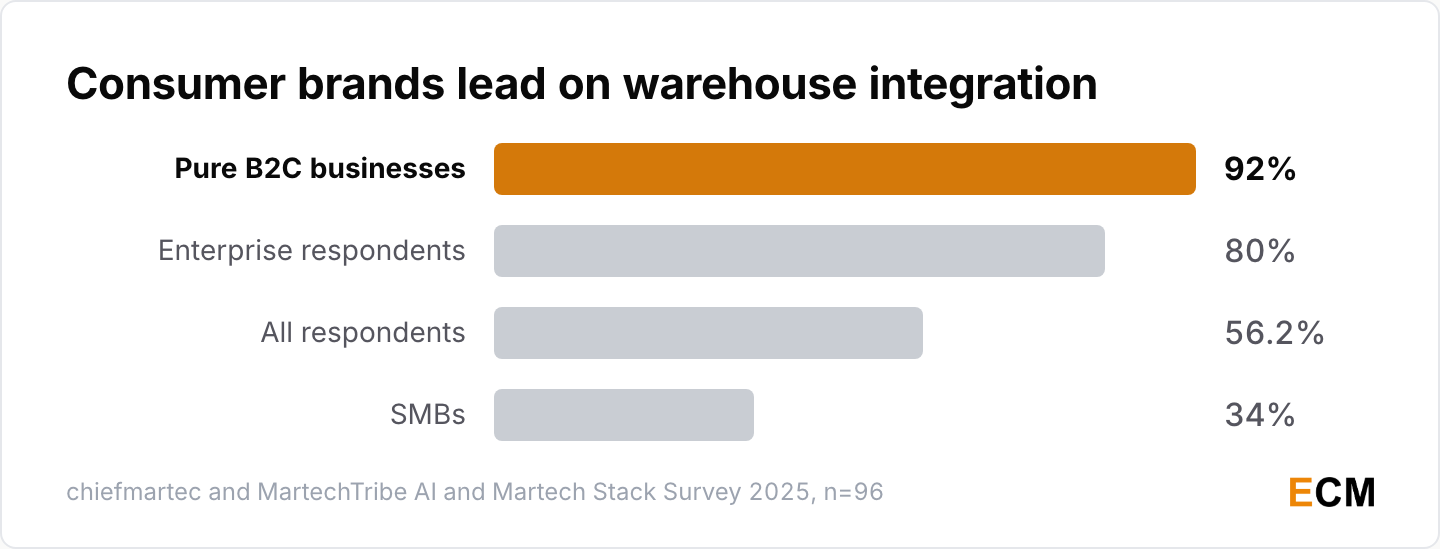
- 56.2% of respondents had integrated their martech stack with a cloud data warehouse or lakehouse (chiefmartec and MartechTribe, 2025).
- That reached 92% of pure B2C businesses and 80% of enterprise respondents against 34% of SMBs (chiefmartec and MartechTribe, 2025).
- Data integration tooling grew 8.0% in the 2026 census, one of the fastest-growing categories (chiefmartec and MartechTribe, 2026).
Frequently Asked Questions
How many martech tools are there in 2026?
15,505, published in the May 2026 marketing technology landscape (chiefmartec and MartechTribe, 2026). That is 0.79% growth, the flattest year since the census began in 2011. The count is judgment-based, so treat it as a directional ceiling rather than a precise number.
What share of marketing budget goes to martech?
Gartner’s marketing technology page puts it at nearly 22% of total marketing spend (Gartner, 2026). The last figure The CMO Survey published was 19.0%, with those leaders expecting 31.7% within five years (The CMO Survey, 2024), and its 2026 edition dropped the line.
How much of a martech stack gets used?
Gartner says only 49% of martech tools are actively used and frames it as a drop (Gartner, 2025). An earlier Gartner survey of 405 marketing leaders measured stack capability instead and put that at 33% in 2023 (Gartner, 2023). On the SaaS side, 36% of licences sit unused (Zylo, 2026). All three are self-reported.
Are AI agents delivering for marketing teams?
Not at the level vendors promise. 45% of martech leaders with agents in pilot or production say capability misses their expectations, while 89% still expect significant benefit (Gartner, 2025). Readiness is the blocker: half of organizations lack the data stack and half lack the technical talent.
What belongs at the center of a martech stack?
A CRM, for 31.3% of the martech leaders surveyed, with marketing automation next at 26% (chiefmartec and MartechTribe, 2025). The cloud data warehouse has already moved ahead of the customer data platform, and 92% of pure B2C businesses have connected their stack to one.
Where is martech spending heading?
Concentrating inside AI. Gartner has marketing budgets at 7.8% of revenue with 15.3% of that going to AI (Gartner, 2026); The CMO Survey has them falling to 9.0% of revenues (The CMO Survey, 2026). Spending on AI-native apps rose 108% in a year (Zylo, 2026). The vendor count has stopped growing, so that money is consolidating rather than spreading.
Written by
Editorial Staff
The Editorial Staff represents the writers, editors, and content creators who have worked (or work) at Elite Content Marketer. The experimenter-in-chief behind the team is Chintan Zalani, who has close to a decade of experience trying to make sense of the content marketing industry. Started in 2019, Elite Content Marketer is on a mission to help creators build sustainable businesses.
Related Articles

Marketing Data
60 B2B Buyer Statistics for 2026: 94% Use AI
60 B2B buyer statistics for 2026: 94% of buyers use LLMs, first contact comes 61% into the journey, and 13 people join the average decision.
Sep 12, 2026Read more →

Marketing Data
60 Zero-Click Search Statistics for 2026: 68% No Click
60 zero-click search statistics for 2026: 68.01% of US Google searches end with no click, AI Overviews cut position 1 CTR 58%, publishers lost 33%.
Sep 12, 2026Read more →
Marketing Data
51 LinkedIn Statistics 2026: Members to Revenue
51 LinkedIn statistics for 2026: 1.3B members, $19.8B in revenue, and 76% of B2B marketers naming it among the most effective thought leadership channels.
Sep 12, 2026Read more →